Exporting Data to Other Formats
In the logging chapter, we learned how Copper records everything
into .copper files and how the log reader can extract text logs and CopperList data as
JSON. But JSON is just the beginning. Real-world workflows often need data in other
formats – CSV for spreadsheets and data science tools, MCAP for visualization in
Foxglove, or statistics JSON for offline performance analysis.
The log reader CLI you already have supports all of these. In this chapter, we’ll explore
every export format and diagnostic tool available in cu29-export.
A quick refresher
Recall from Chapter 13 that your project ships with a log reader binary at
src/logreader.rs:
pub mod tasks;

use cu29::prelude::*;
use cu29_export::run_cli;

gen_cumsgs!("copperconfig.ron");

#[cfg(feature = "logreader")]
fn main() {
    run_cli::<CuStampedDataSet>().expect("Failed to run the export CLI");
}
This program uses the gen_cumsgs! macro to generate a CuStampedDataSet type that knows
how to decode your project’s specific messages. Every subcommand we’ll use in this chapter
goes through this same binary – you just pass different arguments.
Make sure you have a .copper log file from a previous run (see Chapter 13 if you need to
generate one):
ls -lh logs/
-rw-r--r-- 1 user user 4.0K logs/my-project.copper
CSV export
We already saw how extract-copperlists outputs JSON by default. But if you’re working
with spreadsheets, pandas, or any data analysis tool, CSV is often more convenient.
The --export-format flag (or -e for short) switches the output format:
cargo run --features logreader --bin my-project-logreader -- \
    logs/my-project.copper extract-copperlists --export-format csv
The output looks like this:
id, src_time, src_tov, src,, t_0_time, t_0_tov, t_0,, sink_time, sink_tov, sink,
0, [672.083 µs – 734.327 µs], None, {"value":42}, [735.631 µs – 750.445 µs], None, {"value":43}
1, [1.000 s – 1.000 s], None, {"value":42}, [1.000 s – 1.000 s], None, {"value":43}
2, [2.000 s – 2.000 s], None, {"value":42}, [2.000 s – 2.000 s], None, {"value":43}
...
Each row is one CopperList (one execution cycle). The columns are:
id– The CopperList sequence number.<task>_time– The process time range (start-end in nanoseconds) for that task’sprocess()call.<task>_tov– The time of validity, if the task set one.<task>– The payload as inline JSON.
The column headers are generated from your task IDs, so they’ll match whatever you named
your tasks in copperconfig.ron.
Tip: You can redirect the output to a file and open it in any spreadsheet application or load it into a pandas DataFrame:
cargo run --features logreader --bin my-project-logreader -- \
    logs/my-project.copper extract-copperlists -e csv > data.csv
import pandas as pd df = pd.read_csv("data.csv")
Checking log integrity with fsck
Before doing any analysis on a log file, it’s good practice to verify its integrity. The
fsck subcommand reads the entire log and checks that all sections are well-formed:
cargo run --features logreader --bin my-project-logreader -- \
    logs/my-project.copper fsck
The log checked out OK.
        === Statistics ===
  Total time       -> 1.999 s
  Total used size  -> 328 bytes
  Logging rate     -> 0.00 MiB/s (effective)

  # of CL          -> 2
  CL rate          -> 1.00 Hz
  CL total size    -> 129 bytes

  # of Keyframes   -> 1
  KF rate          -> 0.50 Hz
  KF total size    -> 7 bytes

  # of SL entries  -> 13
  SL total size    -> 192 bytes
Even without the verbose flag, fsck gives you a useful summary:
- Total time – How long the recording lasted.
- CL rate – How many CopperLists per second were logged (should match your
rate_target_hz). - Keyframes – Periodic snapshots of frozen task state, used for seeking during replay.
- SL entries – The number of structured log lines (
debug!(),info!(), etc.).
Verbose mode
Add -v for section-by-section details, or -vv for maximum verbosity:
cargo run --features logreader --bin my-project-logreader -- \
    logs/my-project.copper fsck -v
This prints every section header as it’s read, along with the CopperList ID ranges and time ranges within each section. It’s invaluable for debugging corrupted logs – you can see exactly where the corruption starts.
Log statistics
The log-stats subcommand computes per-edge statistics from the log and writes them as a
JSON file. This is useful for offline analysis of your task graph’s performance:
cargo run --features logreader --bin my-project-logreader -- \
    logs/my-project.copper log-stats --output stats.json --config copperconfig.ron
This produces a stats.json file with detailed statistics for every edge in your task
graph:
{
  "schema_version": 1,
  "config_signature": "fnv1a64:166f6eae65f80d15",
  "mission": null,
  "edges": [
    {
      "src": "src",
      "dst": "sink",
      "msg": "crate::tasks::MyPayload",
      "samples": 3,
      "none_samples": 0,
      "valid_time_samples": 3,
      "total_raw_bytes": 12,
      "avg_raw_bytes": 4.0,
      "rate_hz": 1.0004343150476716,
      "throughput_bytes_per_sec": 6.002605890286029
    },
    {
      "src": "src",
      "dst": "t-0",
      "msg": "crate::tasks::MyPayload",
      "samples": 3,
      "none_samples": 0,
      "valid_time_samples": 3,
      "total_raw_bytes": 12,
      "avg_raw_bytes": 4.0,
      "rate_hz": 1.0004343150476716,
      "throughput_bytes_per_sec": 6.002605890286029
    },
    {
      "src": "t-0",
      "dst": "sink",
      "msg": "crate::tasks::MyPayload",
      "samples": 3,
      "none_samples": 0,
      "valid_time_samples": 3,
      "total_raw_bytes": 12,
      "avg_raw_bytes": 4.0,
      "rate_hz": 1.0004283749265024,
      "throughput_bytes_per_sec": 6.002570249559014
    }
  ],
  "perf": {
    "samples": 3,
    "valid_time_samples": 3,
    "end_to_end": {
      "min_ns": 74413,
      "max_ns": 178994,
      "mean_ns": 114416.0,
      "stddev_ns": 46095.0
    },
    "jitter": {
      "min_ns": 15429,
      "max_ns": 104581,
      "mean_ns": 60005.0,
      "stddev_ns": 44576.0
    }
  }
}
For each edge in the graph, you get:
samples– Total number of CopperLists processed.none_samples– How many times the payload wasNone(the task produced no output for that cycle).rate_hz– The measured message rate on this edge.avg_raw_bytes– Average payload size in bytes.throughput_bytes_per_sec– Sustained data throughput on this edge.
The perf section gives you pipeline-level timing:
end_to_end– Latency from the first task’sprocess()start to the last task’sprocess()end, across the full pipeline.jitter– Variation in that end-to-end latency between consecutive cycles.
Using with missions
If your project uses missions, pass the --mission flag to select which
mission’s graph to use for the edge mapping:
cargo run --features logreader --bin my-project-logreader -- \
    logs/my-project.copper log-stats --config copperconfig.ron --mission normal
MCAP export for Foxglove
MCAP is an open-source container format designed for multimodal robotics data. It’s the native format of Foxglove, a powerful web-based visualization tool for robotics. Exporting your Copper logs to MCAP lets you visualize your pipeline’s data in Foxglove’s timeline, plot panels, and 3D views.
Enabling the MCAP feature
MCAP export requires an additional feature flag. Add mcap to your logreader’s feature
dependencies in Cargo.toml:
[features]
logreader = ["dep:cu29-export"]
logreader-mcap = ["logreader", "cu29-export/mcap"]
And make sure your existing cu29-export dependency enables the "mcap" feature.
Note: If your project already depends on
cu29-exportviagit, a localpath, or crates.io, keep that same source and Copper release and just add the"mcap"feature.
Implementing PayloadSchemas
When the mcap feature is enabled, run_cli requires your CuStampedDataSet to
implement the PayloadSchemas trait. This trait tells the MCAP exporter what JSON Schema
to use for each task’s payload, so Foxglove can understand your data structure.
The gen_cumsgs! macro does not implement this trait automatically – you need to add
the implementation yourself in src/logreader.rs. Here’s what it looks like for our
project where every task uses MyPayload:
pub mod tasks;

use cu29::prelude::*;
use cu29_export::run_cli;

gen_cumsgs!("copperconfig.ron");

#[cfg(feature = "logreader-mcap")]
use cu29_export::serde_to_jsonschema::trace_type_to_jsonschema;
#[cfg(feature = "logreader-mcap")]
impl PayloadSchemas for cumsgs::CuStampedDataSet {
    fn get_payload_schemas() -> Vec<(&'static str, String)> {
        let task_ids =
            <cumsgs::CuStampedDataSet as MatchingTasks>::get_all_task_ids();
        let schema = trace_type_to_jsonschema::<tasks::MyPayload>();
        task_ids.iter().map(|&id| (id, schema.clone())).collect()
    }
}

fn main() {
    run_cli::<CuStampedDataSet>().expect("Failed to run the export CLI");
}
The key pieces:
trace_type_to_jsonschema::<T>()– Introspects a Rust type at compile time usingserde-reflectionand produces a JSON Schema string. Your payload type must deriveSerializeandDeserialize.MatchingTasks::get_all_task_ids()– Returns the task IDs from your config, in graph order. The macro generates this for you.- The
#[cfg(feature = "logreader-mcap")]guard ensures this code only compiles when the MCAP feature is active, so your regularlogreaderfeature keeps working without the extra dependency.
If your tasks use different payload types, you’ll need to map each task ID to its specific schema instead of reusing a single one. See the cu_caterpillar example in the Copper repository for a reference.
Exporting to MCAP
Once the feature is enabled, a new export-mcap subcommand becomes available:
cargo run --features logreader-mcap --bin my-project-logreader -- \
    logs/my-project.copper export-mcap --output data.mcap
Exporting copperlists to MCAP format: data.mcap
MCAP Export: 5 CopperLists → 10 messages, 2 channels, 2 schemas
The export creates one MCAP channel per task output (named /<task-id>), and one
schema per message type. Schemas are generated automatically at compile time using
serde-reflection – the exporter introspects your Rust types and produces JSON Schema
definitions that Foxglove can use to understand the data structure.
Each MCAP message contains:
payload– Your task’s output, serialized as JSON.tov– The time of validity.process_time– Start and end timestamps of the task’sprocess()call.status_txt– Any status text the task set.
Inspecting MCAP files
The mcap-info subcommand lets you inspect an MCAP file without opening Foxglove:
cargo run --features logreader-mcap --bin my-project-logreader -- \
    logs/my-project.copper mcap-info data.mcap
=== MCAP File Info ===
File: data.mcap
Size: 2617 bytes (0.00 MB)

=== Statistics ===
Total messages: 9
Channels: 3
Schemas: 3

=== Channels ===
  /sink [json] (schema: copper.sink): 3 messages
  /src [json] (schema: copper.src): 3 messages
  /t_0 [json] (schema: copper.t_0): 3 messages

=== Schemas ===
Schema: copper.sink (encoding: jsonschema)

Schema: copper.src (encoding: jsonschema)

Schema: copper.t_0 (encoding: jsonschema)
Add --schemas to print the full JSON Schema for each channel, or -n 3 to show the
first 3 sample messages per channel:
cargo run --features logreader-mcap --bin my-project-logreader -- \
    logs/my-project.copper mcap-info data.mcap --schemas -n 1
Opening in Foxglove
Once you have an .mcap file, open it in Foxglove:
- Go to app.foxglove.dev (or use the desktop app).
- Click “Open local file” and select your
.mcapfile. - Your channels (
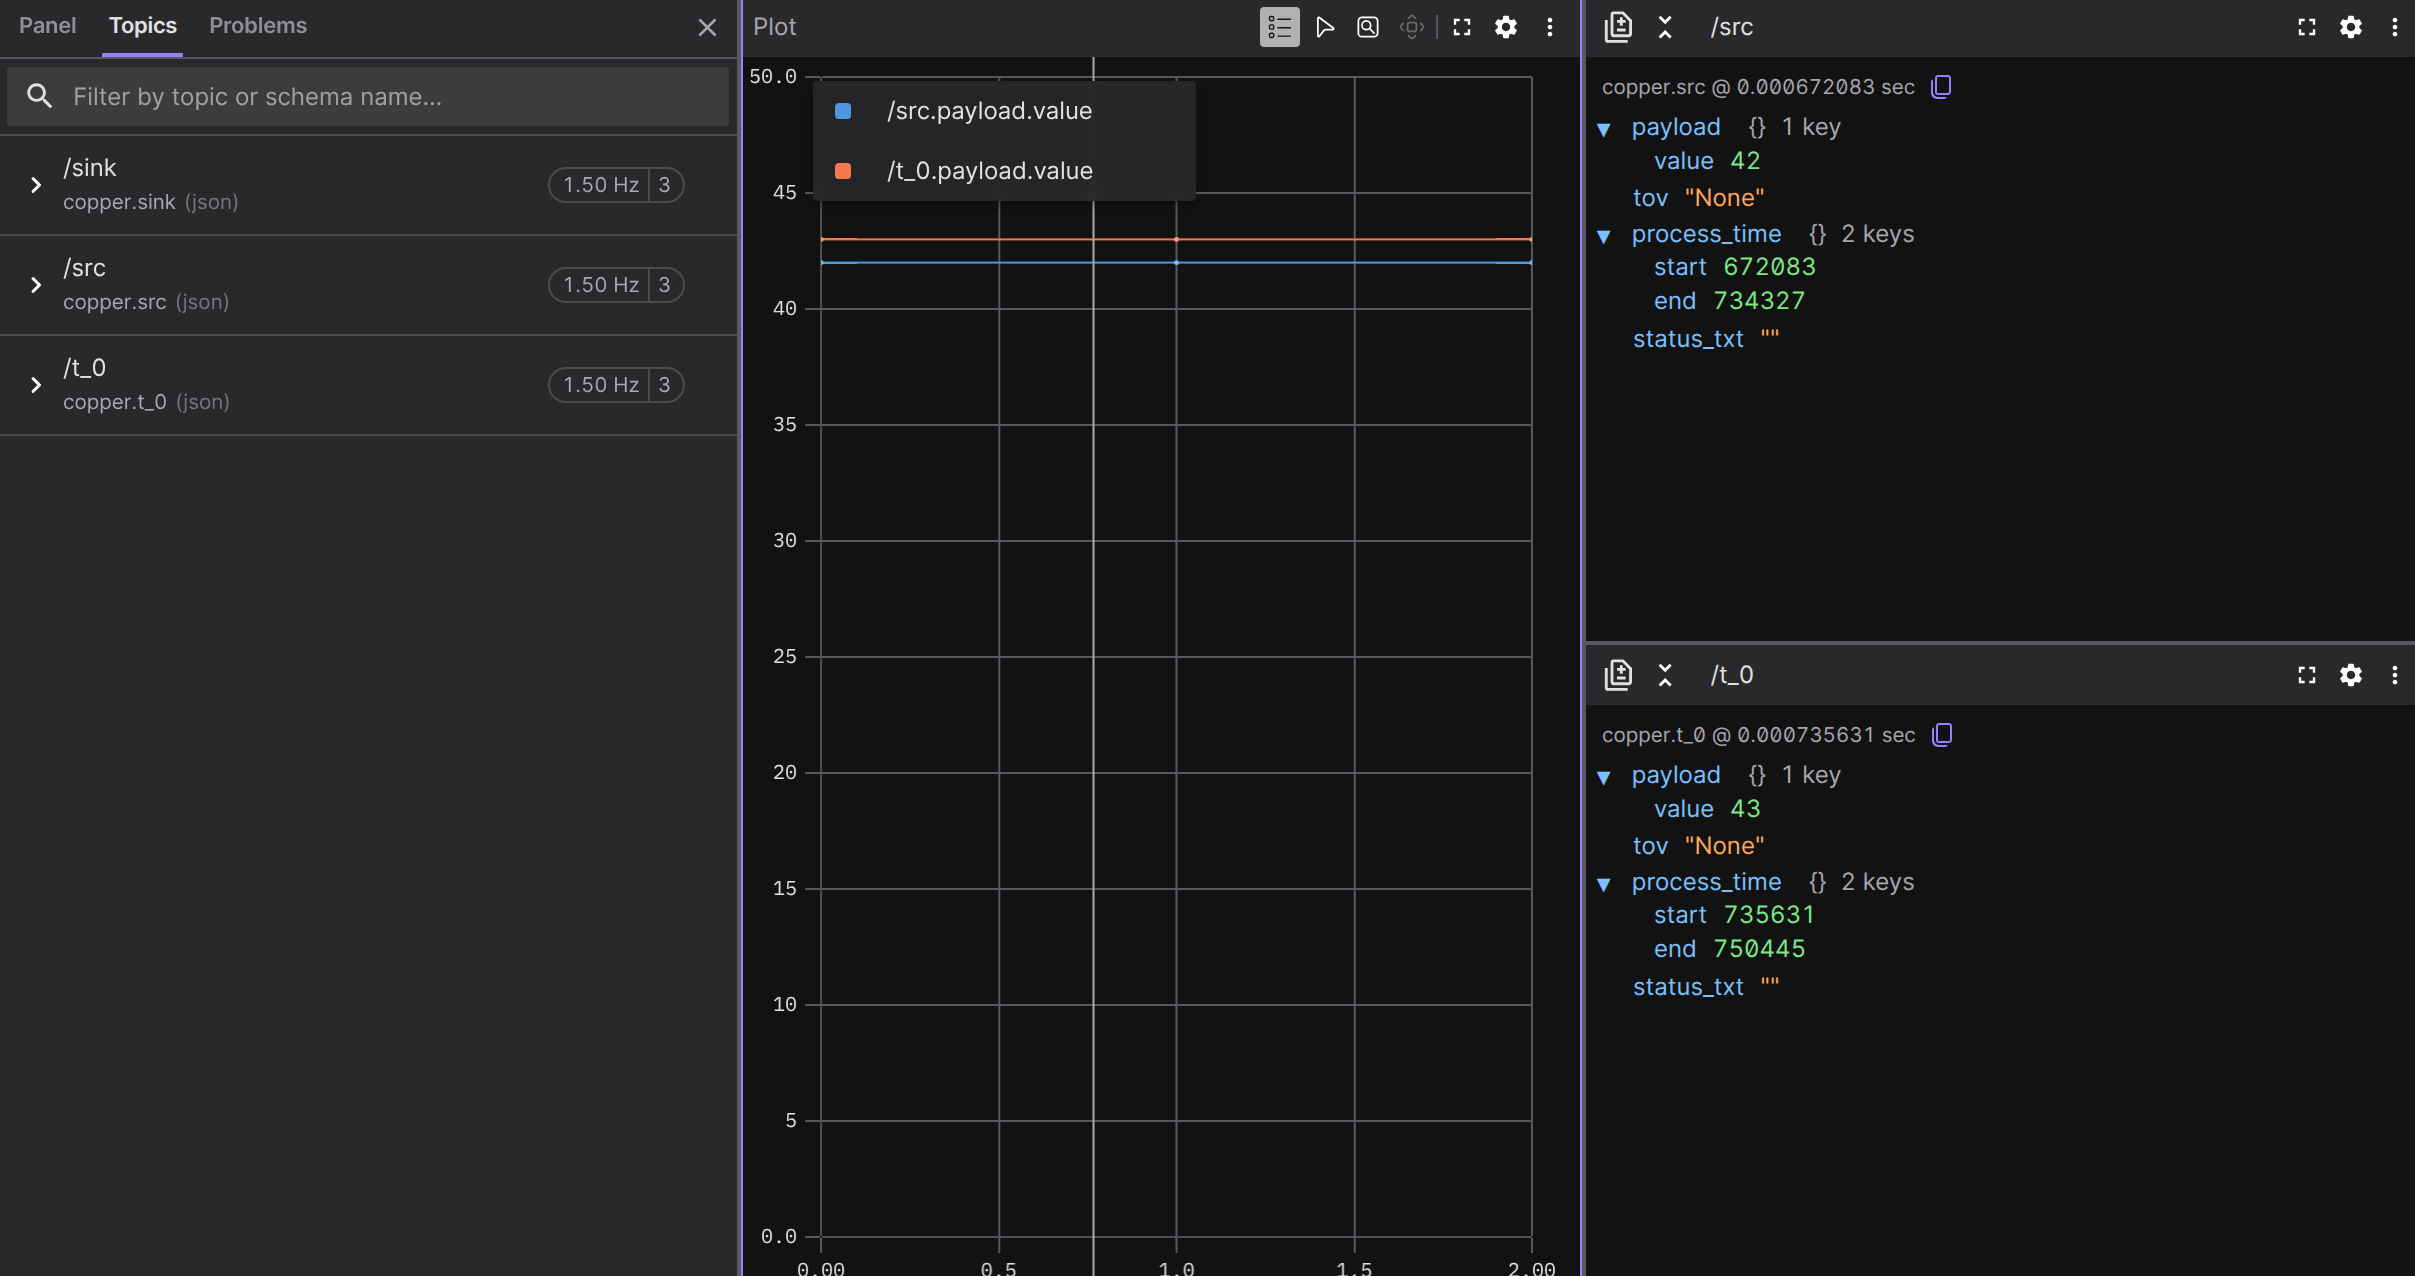
/src,/t-0, etc.) appear in the sidebar. - Add a Raw Messages panel to see the JSON payloads, or a Plot panel to graph numeric fields over time.
Because the MCAP file includes JSON Schema definitions, Foxglove knows the structure of your messages and can offer autocomplete for field names in plots.
Foxglove has plenty of tutorials on how to set up the Panels. Here is a basic UI showing our data with plots and raw messages:
Summary of subcommands
Here’s a quick reference for all the log reader subcommands:
| Subcommand | What it does | Feature needed |
|---|---|---|
extract-text-log <index> | Reconstructs human-readable text logs | – |
extract-copperlists | Dumps CopperList data (JSON or CSV) | – |
extract-copperlists -e csv | Dumps CopperList data as CSV | – |
fsck | Checks log integrity and prints statistics | – |
log-stats | Computes per-edge statistics as JSON | – |
export-mcap --output f.mcap | Exports to MCAP format for Foxglove | mcap |
mcap-info <file> | Inspects an MCAP file | mcap |