Introduction
Welcome to Learning copper-rs, a hands-on guide to building robots with the Copper deterministic robotics operating system.
Most people learn Rust with the amazing Rust Book, so we built it for copper-rs.
This book has been written with the help of AI, for the sake of speed, proper grammar and formatting, but each and every line has been reviewed by a human.
The source for this book is available on GitHub. Feedback and contributions are welcome.
This book will take you from zero to a running Copper project, one concept at a time. By the end, you’ll understand how to define task graphs, write sensor drivers and processing pipelines, and run everything with sub-microsecond deterministic scheduling.
Who is this for?
This book is aimed at:
- Robotics developers coming from ROS / ROS 2 who want to explore a Rust-native alternative
- Rust developers interested in robotics and real-time systems
- Beginners who want a gentle, progressive introduction to Copper’s architecture
No prior Copper experience is required. Familiarity with Rust syntax is helpful but any experience with other programming language should allow you to get through.
Let’s get started!
What is copper-rs?
Copper is a deterministic robotics runtime written in Rust. Think of it as a “game engine for robots”: describe your system declaratively and Copper will create a custom scheduler and run it deterministically from cloud simulation down to embedded controllers.
The big idea
You describe your robot as a task graph – a directed graph of components that produce, process, and consume data. Copper reads this graph at compile time and generates a custom deterministic scheduler. At runtime, your tasks execute in a precise, pre-computed order with zero overhead.
  ┌──────────┐     ┌──────────┐     ┌──────────┐
  │  Sensor  │────▶│ Algorithm│────▶│ Actuator │
  │  (Source)│     │  (Task)  │     │  (Sink)  │
  └──────────┘     └──────────┘     └──────────┘
Key features
- Rust-first – Ergonomic and safe.
- Sub-microsecond latency – Zero-alloc, data-oriented runtime.
- Deterministic replay – Every run, bit-for-bit identical.
- Interoperable with ROS 2 – Bridges via Zenoh, opening the path for a progressive migration.
- Runs anywhere – From Linux servers, workstations, and SBCs to bare-metal MPUs.
- Built to ship – One stack from simulation to production.
How it works (in 30 seconds)
- You define your tasks (Rust structs that implement a trait).
- You wire them together in a configuration file (
copperconfig.ron). - A compile-time macro reads the config and generates the scheduler.
- At runtime, Copper calls your tasks’
process()methods in the optimal order, passing pre-allocated messages between them.
That’s it. No topic discovery, no callback registration, no middleware configuration. Define, wire, run.
copper-rs vs ROS
If you’re coming from ROS or ROS 2, this chapter maps the concepts you already know to their Copper equivalents. The mental model is similar. Both are component-based frameworks with message passing, but the execution model is fundamentally different.
Concept mapping
| ROS 2 | copper-rs | Notes |
|---|---|---|
| Node | Task | A unit of computation |
| Publisher | CuSrcTask | Produces data (sensor driver) |
| Subscriber + Publisher | CuTask | Processes data (algorithm) |
| Subscriber | CuSinkTask | Consumes data (actuator) |
.msg file | Rust struct with derives | Message definition |
| Topic | Connection in copperconfig.ron | Data channel between tasks |
| Launch file + YAML params | copperconfig.ron | Graph topology + task parameters |
colcon build | cargo build | Build system |
package.xml / CMakeLists.txt | Cargo.toml | Dependency management |
| Executor | #[copper_runtime] macro | Generated deterministic scheduler |
rosbag | Unified Logger + cu29-export | Record and replay |
| Parameter server | ComponentConfig in RON | Per-task key-value configuration |
Key differences
Scheduling
In ROS 2, nodes are separate processes (or threads in a composed executor). Callbacks fire asynchronously when messages arrive via DDS. The execution order depends on network timing and OS scheduling – it’s non-deterministic.
In Copper, tasks run in the same process and are called synchronously in a compile-time-determined order. Every cycle, every task runs in the exact same sequence. There are no callbacks, no races, no surprises.
Message passing
In ROS 2, messages are serialized, sent over DDS (a network middleware), deserialized, and delivered to callbacks. This adds latency and allocations.
In Copper, messages are pre-allocated buffers in shared memory. A task writes its output directly into a buffer that the next task reads from. No serialization, no copies, no allocations on the hot path.
Replay
In ROS 2, rosbag records and replays topic messages. Replay is approximate – timing
jitter, OS scheduling, and node startup order can cause differences.
In Copper, replay is deterministic. The unified logger records every message and periodic state snapshots (“keyframes”). Given the same log, replay produces identical results every time, down to the bit.
Configuration
In ROS 2, you typically write a launch file (Python or XML), separate YAML parameter files, and topic remappings. These are resolved at runtime.
In Copper, everything is in one RON file (copperconfig.ron) that is read at
compile time. If your config references a task type that doesn’t exist, you get a
compile error, not a runtime crash.
Bridges
The good news is that you do not have to chose between Copper and ROS: Copper’s Zenoh bridge lets you run both side by side, so you can migrate incrementally.
Setting Up Your Environment
Before we can build a Copper project, we need Rust 1.95 or newer and the Copper project bootstrap tool.
Install Rust
Follow the official installation guide at https://rust-lang.org/tools/install/, or run:
curl --proto '=https' --tlsv1.2 -sSf https://sh.rustup.rs | sh
After installation, make sure cargo is available and recent enough:
cargo --version
rustc --version
Install cargo-cunew
cargo-cunew scaffolds a new Copper project from the official Copper templates:
cargo install cargo-cunew
Generate our first simple Copper project
Generate a new project directly:
cargo cunew my_project
This generates a complete, ready-to-compile Copper project at the path you specify.
For more details, see the official documentation: https://copper-project.github.io/copper-rs/Project-Templates/
What you get
The generated project contains everything you need:
my_project/
├── build.rs              # Build script (required by Copper logging)
├── Cargo.toml            # Dependencies
├── copperconfig.ron      # Task graph definition
├── justfile              # Helper commands (logreader, replay, DAG rendering)
└── src/
    ├── main.rs           # Runtime entry point
    ├── logreader.rs      # Offline log export utility
    ├── resim.rs          # Replay / remote-debug entry point
    └── tasks.rs          # Your task implementations
In the next chapter, we’ll explore what each of these files does.
Try it
You can try to compile and run your project:
cd my_project
cargo run
It will compile and run, and you’ll start to receive some messages:
00:00:01.1781 [Debug] Received message: 42
00:00:01.1781 [Debug] Sink Received message: 43
Kill the process and let’s move to the next chapter.
Project Structure Overview
Let’s look at what’s inside a Copper project and understand the role of each file. Here’s the layout generated by the template:
my_project/
├── build.rs              # Build script (sets up logging index)
├── Cargo.toml            # Dependencies and project metadata
├── copperconfig.ron      # Task graph definition
├── justfile              # Helper commands for logs, replay, and DAG rendering
└── src/
    ├── main.rs           # Runtime entry point
    ├── tasks.rs          # Your task implementations
    ├── logreader.rs      # Log export utility
    └── resim.rs          # Replay / remote-debug entry point
Which files do I actually work on?
Great news: in the next chapters, we will mainly focus on two files:
| File | What you do there | ROS 2 equivalent |
|---|---|---|
tasks.rs | Implement tasks + define message types | Node source files + .msg files |
copperconfig.ron | Define the task graph, wire connections, set parameters | Launch file + YAML params |
The rest is scaffolding that you set up once and rarely change:
| File | Role | How often you touch it |
|---|---|---|
main.rs | Boilerplate: create logger, build runtime, call run() | Rarely |
build.rs | Sets an env var for Copper’s logging macros | Never |
logreader.rs | CLI tool to decode and export Copper’s binary logs | Rarely |
resim.rs | Replay target for deterministic re-simulation and remote debug | Rarely |
justfile | Shortcuts for common commands like just log and just dag | Occasionally |
Cargo.toml | Dependencies | When adding new hardware driver crates |
The mental model
Think of it this way:
copperconfig.ronis the architecture of your robot – what components exist and how they connect. It’s declarative.tasks.rsis the behavior of your robot – what each component actually does. It’s imperative Rust code.main.rsis the engine startup – it boots the runtime that executes your architecture and behavior. You don’t need to understand it deeply to get started.
In the next chapters, we’ll dive into each of these files, starting with the task graph configuration.
The Task Graph: copperconfig.ron
The file copperconfig.ron is the heart of your robot’s architecture. It defines what
tasks exist, how they connect, and what parameters they receive. Copper reads
this file at compile time to generate a deterministic scheduler.
The format is RON (Rusty Object Notation) – a human-readable data format designed for Rust.
The complete example
Here is the copperconfig.ron from our template project:
(
    tasks: [
        (
            id: "src",
            type: "tasks::MySource",
        ),
        (
            id: "t-0",
            type: "tasks::MyTask",
        ),
        (
            id: "sink",
            type: "tasks::MySink",
        ),
    ],
    cnx: [
        (
            src: "src",
            dst: "t-0",
            msg: "crate::tasks::MyPayload",
        ),
        (
            src: "t-0",
            dst: "sink",
            msg: "crate::tasks::MyPayload",
        ),
    ],
)
This defines a three-task pipeline:
MySource  ──▶  MyTask  ──▶  MySink
  "src"        "t-0"        "sink"
We will discuss these 3 traits (Source, Task, Sink) later.
For the moment, let’s focus on the content of the file.
The tasks section
Each entry in the tasks array declares one task:
(
    id: "src",                    // Unique string identifier
    type: "tasks::MySource",      // Rust type that implements the task
    kind: source,                 // Optional but recommended: source | task | sink
),
id– A unique name for this task instance. Used to reference it in connections.type– The fully qualified path to the Rust struct (relative to your crate root).kind– Declares whether the Rust type implementsCuSrcTask,CuTask, orCuSinkTask. Usesource,task, orsink. Copper can still infer this for legacy configs when the graph shape is unambiguous, but explicitkindis the preferred form.
Optional task fields
Beyond id and type, each task entry supports several optional fields:
-
config– A key-value map of parameters passed to the task’snew()constructor as anOption<&ComponentConfig>. We’ll see how to read them in the Task Anatomy chapter.( id: "gpio", type: "cu_rp_gpio::RPGpio", config: { "pin": 4, }, ), -
missions– A list of mission IDs in which this task is active. Copper supports defining multiple “missions” (configurations of the same robot for different scenarios). A task only gets instantiated if the current mission is in its list. If omitted, the task is active in all missions.( id: "lidar", type: "tasks::LidarDriver", missions: ["outdoor", "mapping"], ), -
background– When set totrue, a source or compatible task runs on a background thread instead of the critical path. Useful for stages that do heavy or blocking work (network I/O, disk writes) that shouldn’t affect the deterministic scheduling of other tasks.( id: "telemetry", type: "tasks::TelemetryUploader", background: true, ), -
logging– Controls whether Copper’s unified logger records the output messages of this task. Setenabled: falseto reduce log size for high-frequency or uninteresting tasks.( id: "fast-sensor", type: "tasks::HighRateSensor", logging: (enabled: false), ),
The cnx (connections) section
Each entry in cnx wires one task’s output to another’s input:
(
src: "src", // Producing task's id
dst: "t-0", // Consuming task's id
msg: "crate::tasks::MyPayload", // Rust type of the message payload
),
-
src– Theidof the task producing the message. -
dst– Theidof the task consuming the message. -
msg– The fully qualified Rust type of the payload (see next chapter for a focus on this). -
missions(optional) – A list of mission IDs in which this connection is active, just like themissionsfield on tasks. If omitted, the connection is active in all missions.( src: "lidar", dst: "mapper", msg: "crate::tasks::PointCloud", missions: ["outdoor", "mapping"], ),
If a source or regular task intentionally exposes an output that is unused in a given
graph, point that connection at dst: "__nc__". This keeps the output message type
explicit without adding a dummy sink.
How this compares to ROS
In ROS 2, you’d create publishers and subscribers on named topics, and they’d find each
other at runtime via DDS discovery. In Copper, connections are explicit and resolved at
compile time. If you reference a task id that doesn’t exist, you get a compile error –
not a silent runtime misconfiguration.
There’s more
The configuration file we’ve seen here is minimal on purpose. Real-world Copper projects can use additional top-level sections for monitoring, logging tuning, rate limiting, missions, and modular composition. We’ll cover these throughout the book as we go.
Defining Messages
Messages (also called payloads) are the data that flows between tasks. In ROS, you’d
define these in .msg files and run a code generator. In Copper, they’re just Rust structs
with the right derives.
A custom payload
Here’s the message type from our template project (in src/tasks.rs):
#![allow(unused)]
fn main() {
use bincode::{Decode, Encode};
use cu29::prelude::*;
use serde::{Deserialize, Serialize};
#[derive(Default, Debug, Clone, Encode, Decode, Serialize, Deserialize, Reflect)]
pub struct MyPayload {
value: i32,
}
}What each derive does
Every derive on a payload struct has a specific purpose:
| Derive | Purpose |
|---|---|
Default | Required. Copper pre-allocates message buffers at startup. Default provides the initial “empty” value. |
Encode, Decode | Binary serialization for Copper’s zero-alloc message buffers and logging. These come from cu-bincode. |
Serialize, Deserialize | Used for configuration parsing, log export (MCAP, JSON), and tooling. These come from serde. |
Reflect | Runtime type introspection for monitoring tools and simulation integration. |
Debug | Human-readable printing for development. |
Clone | Allows copying messages when needed (e.g., forking data to multiple consumers). |
You do not really have to worry about all of these derives for now. Just add them each time you define a message, and we’ll see how they come into action later.
Using primitive types
For simple cases, you don’t need a custom struct at all. Primitive types like i32, f64,
and bool already implement all the required traits:
#![allow(unused)]
fn main() {
// In copperconfig.ron:
// msg: "i32"
// In your task:
type Output<'m> = output_msg!(i32);
}This is great for prototyping. As your robot grows, you’ll likely define richer message types with multiple fields.
Latched state updates
Not every payload is a fresh sample. Some values are low-rate state: camera calibration, static transforms, lookup tables, map metadata, and similar data that usually stays the same for many cycles.
Re-sending the full value every cycle is wasteful, but making it implicit would hurt determinism and replay. Copper therefore models this explicitly:
CuLatchedStateUpdate<T>is the message that flows across the connectionCuLatchedState<T>is the consumer-side cache stored in your task state
The update variants are:
NoChange– keep the previously latched valueSet(value)– replace the previously latched valueClear– remove the previously latched value
The important mental model is that Copper does not automatically “remember the last
message” for you. The state transition is the message. Each downstream task that needs the
value keeps its own CuLatchedState<T> and applies updates as they arrive.
Producer side
A source or task that discovers calibration data might publish it once with Set(...),
then emit NoChange on later cycles until something changes:
#![allow(unused)]
fn main() {
type Output<'m> = output_msg!(CuLatchedStateUpdate<CameraCalibration>);
fn process(&mut self, _ctx: &CuContext, output: &mut Self::Output<'_>) -> CuResult<()> {
if let Some(calibration) = self.pending_calibration.take() {
output.set_payload(CuLatchedStateUpdate::Set(calibration));
} else {
output.set_payload(CuLatchedStateUpdate::NoChange);
}
Ok(())
}
}If the cached value becomes invalid, emit CuLatchedStateUpdate::Clear.
Consumer side
The consumer stores the latest latched value in its own task state:
#![allow(unused)]
fn main() {
pub struct DepthProjector {
calibration: CuLatchedState<CameraCalibration>,
}
fn process(&mut self, _ctx: &CuContext, input: &Self::Input<'_>,
output: &mut Self::Output<'_>) -> CuResult<()> {
if let Some(update) = input.payload() {
self.calibration.update(update);
}
let Some(calibration) = self.calibration.get() else {
return Ok(());
};
output.set_payload(project_depth_with(calibration));
Ok(())
}
}This pattern keeps the common case cheap, because NoChange is just a tiny explicit
update, while still making the state evolution visible in logs and deterministic replay.
Using units directly in payloads
Copper exposes the cu29-units wrappers (through cu29::units) so your payload fields can
carry units directly instead of raw f32 values.
#![allow(unused)]
fn main() {
use bincode::{Decode, Encode};
use cu29::prelude::*;
use cu29::units::si::f32::{Length, Time, Velocity};
use cu29::units::si::length::{inch, meter};
use cu29::units::si::time::second;
use cu29::units::si::velocity::{kilometer_per_hour, meter_per_second};
use serde::{Deserialize, Serialize};
#[derive(Default, Debug, Clone, Encode, Decode, Serialize, Deserialize, Reflect)]
pub struct WheelSample {
pub distance: Length,
pub dt: Time,
pub speed: Velocity,
}
impl WheelSample {
pub fn from_raw(distance_m: f32, dt_s: f32) -> Self {
let distance = Length::new::<meter>(distance_m);
let dt = Time::new::<second>(dt_s);
// m / s -> m/s
let speed: Velocity = (distance.into_uom() / dt.into_uom()).into(); // this is type safe
Self {
distance,
dt,
speed,
}
}
pub fn distance_in_inches(&self) -> f32 {
self.distance.get::<inch>()
}
pub fn speed_mps(&self) -> f32 {
self.speed.get::<meter_per_second>()
}
pub fn speed_kph(&self) -> f32 {
self.speed.get::<kilometer_per_hour>()
}
}
}This gives you unit-safe fields in messages, unit-safe math when building messages, and explicit
conversions when consuming them. Wrapper types support same-dimension arithmetic (+, -) and
scalar scale (* f32, / f32) directly; for cross-dimension operations (like Length / Time),
compute with the underlying uom quantity and convert back with .into() (or from_uom).
Designing good payloads
A few tips for payload design:
- Keep payloads small. They’re pre-allocated and copied between cycles. Large payloads waste memory and cache space.
- Use fixed-size types. Avoid
StringorVecon the critical path. Prefer arrays, fixed-size buffers, or enums. - One struct per “topic”. Each connection in
copperconfig.roncarries exactly one message type. If you need to send different kinds of data, define different structs and use separate connections.
Example: an IMU payload
Here’s what a more realistic payload might look like for an IMU sensor (from here):
#![allow(unused)]
fn main() {
#[derive(Default, Debug, Clone, Encode, Decode, Serialize, Deserialize, Reflect)]
pub struct ImuPayload {
pub accel_x: Acceleration,
pub accel_y: Acceleration,
pub accel_z: Acceleration,
pub gyro_x: AngularVelocity,
pub gyro_y: AngularVelocity,
pub gyro_z: AngularVelocity,
pub temperature: ThermodynamicTemperature,
}
}In the next chapter, we’ll see how tasks produce and consume these messages.
For more advanced unit algebra, dimensions, and available units, see the underlying
uom crate docs.
Writing Tasks: tasks.rs
In the previous chapters we looked at copperconfig.ron (the architecture) and message
payloads (the data). Now let’s look at tasks.rs – where the actual behavior lives.
Just like the task graph chapter, we’ll start with the complete file and then break it down piece by piece.
The complete file
Here is the full tasks.rs from our template project:
#![allow(unused)]
fn main() {
use bincode::{Decode, Encode};
use cu29::prelude::*;
use serde::{Deserialize, Serialize};
// Define a message type
#[derive(Default, Debug, Clone, Encode, Decode, Serialize, Deserialize, Reflect)]
pub struct MyPayload {
value: i32,
}
// Defines a source (ie. driver)
#[derive(Default, Reflect)]
pub struct MySource {}
impl Freezable for MySource {}
impl CuSrcTask for MySource {
type Resources<'r> = ();
type Output<'m> = output_msg!(MyPayload);
fn new(_config: Option<&ComponentConfig>, _resources: Self::Resources<'_>) -> CuResult<Self>
where
Self: Sized,
{
Ok(Self {})
}
fn process(&mut self, _ctx: &CuContext, output: &mut Self::Output<'_>) -> CuResult<()> {
output.set_payload(MyPayload { value: 42 });
Ok(())
}
}
// Defines a processing task
#[derive(Reflect)]
pub struct MyTask {}
impl Freezable for MyTask {}
impl CuTask for MyTask {
type Resources<'r> = ();
type Input<'m> = input_msg!(MyPayload);
type Output<'m> = output_msg!(MyPayload);
fn new(_config: Option<&ComponentConfig>, _resources: Self::Resources<'_>) -> CuResult<Self>
where
Self: Sized,
{
Ok(Self {})
}
fn process(
&mut self,
_ctx: &CuContext,
input: &Self::Input<'_>,
output: &mut Self::Output<'_>,
) -> CuResult<()> {
debug!("Received message: {}", input.payload().unwrap().value);
output.set_payload(MyPayload { value: 43 });
Ok(())
}
}
// Defines a sink (ie. actuation)
#[derive(Default, Reflect)]
pub struct MySink {}
impl Freezable for MySink {}
impl CuSinkTask for MySink {
type Resources<'r> = ();
type Input<'m> = input_msg!(MyPayload);
fn new(_config: Option<&ComponentConfig>, _resources: Self::Resources<'_>) -> CuResult<Self>
where
Self: Sized,
{
Ok(Self {})
}
fn process(&mut self, _ctx: &CuContext, input: &Self::Input<'_>) -> CuResult<()> {
debug!("Sink Received message: {}", input.payload().unwrap().value);
Ok(())
}
}
}That’s the entire file. Let’s walk through it section by section.
The imports
#![allow(unused)]
fn main() {
use bincode::{Decode, Encode};
use cu29::prelude::*;
use serde::{Deserialize, Serialize};
}cu29::prelude::*– Brings in everything you need from Copper: task traits,CuContext,ComponentConfig,CuResult,Freezable,Reflect, theinput_msg!/output_msg!macros, and thedebug!logging macro.bincodeandserde– For the serialization derives onMyPayload(covered in the Defining Messages chapter).
The message type
#![allow(unused)]
fn main() {
#[derive(Default, Debug, Clone, Encode, Decode, Serialize, Deserialize, Reflect)]
pub struct MyPayload {
value: i32,
}
}We already covered this in the previous chapter. This is the data that flows between tasks
through the connections defined in copperconfig.ron.
The three task traits
The file defines three structs, each implementing a different trait. Copper provides three task traits for the three roles a task can play in the pipeline:
| Trait | Role | Has Input? | Has Output? | ROS Analogy |
|---|---|---|---|---|
CuSrcTask | Produces data | No | Yes | Publisher / driver node |
CuTask | Transforms data | Yes | Yes | Subscriber + Publisher |
CuSinkTask | Consumes data | Yes | No | Subscriber / actuator node |
Let’s look at each one.
Source Task: CuSrcTask – MySource
#![allow(unused)]
fn main() {
#[derive(Default, Reflect)]
pub struct MySource {}
impl Freezable for MySource {}
impl CuSrcTask for MySource {
type Resources<'r> = ();
type Output<'m> = output_msg!(MyPayload);
fn new(_config: Option<&ComponentConfig>, _resources: Self::Resources<'_>) -> CuResult<Self>
where
Self: Sized,
{
Ok(Self {})
}
fn process(&mut self, _ctx: &CuContext, output: &mut Self::Output<'_>) -> CuResult<()> {
output.set_payload(MyPayload { value: 42 });
Ok(())
}
}
}A source is the entry point of data into the pipeline. It has no input – it generates data, typically by reading from hardware (a camera, an IMU, a GPIO pin).
What happens each cycle: The runtime calls process(), and MySource writes a
MyPayload { value: 42 } into the pre-allocated output buffer. Downstream tasks will
read this value.
Notice the process() signature: it only has output, no input.
Processing Task: CuTask – MyTask
#![allow(unused)]
fn main() {
#[derive(Reflect)]
pub struct MyTask {}
impl Freezable for MyTask {}
impl CuTask for MyTask {
type Resources<'r> = ();
type Input<'m> = input_msg!(MyPayload);
type Output<'m> = output_msg!(MyPayload);
fn new(_config: Option<&ComponentConfig>, _resources: Self::Resources<'_>) -> CuResult<Self>
where
Self: Sized,
{
Ok(Self {})
}
fn process(
&mut self,
_ctx: &CuContext,
input: &Self::Input<'_>,
output: &mut Self::Output<'_>,
) -> CuResult<()> {
debug!("Received message: {}", input.payload().unwrap().value);
output.set_payload(MyPayload { value: 43 });
Ok(())
}
}
}A processing task sits in the middle of the pipeline. It reads from upstream and writes downstream.
What happens each cycle: The runtime first runs the upstream source, then calls this
task’s process() with the source’s output as input. The task reads the value, logs it,
and writes a new value to its own output for the sink downstream.
Notice the process() signature: it has both input and output.
Sink Task: CuSinkTask – MySink
#![allow(unused)]
fn main() {
#[derive(Default, Reflect)]
pub struct MySink {}
impl Freezable for MySink {}
impl CuSinkTask for MySink {
type Resources<'r> = ();
type Input<'m> = input_msg!(MyPayload);
fn new(_config: Option<&ComponentConfig>, _resources: Self::Resources<'_>) -> CuResult<Self>
where
Self: Sized,
{
Ok(Self {})
}
fn process(&mut self, _ctx: &CuContext, input: &Self::Input<'_>) -> CuResult<()> {
debug!("Sink Received message: {}", input.payload().unwrap().value);
Ok(())
}
}
}A sink is the end of the pipeline. It receives data but produces no output. Typically this drives an actuator, writes to a display, or sends data to an external system.
What happens each cycle: The runtime calls process() with the upstream task’s output.
The sink reads the value and does something with it (here, it logs it).
Notice the process() signature: it only has input, no output.
Tying it back to the task graph
Remember our copperconfig.ron:
tasks: [
( id: "src", type: "tasks::MySource" ),
( id: "t-0", type: "tasks::MyTask" ),
( id: "sink", type: "tasks::MySink" ),
],
Each type field points to one of the structs we just defined. The connections in cnx
determine which task’s output feeds into which task’s input. The Rust compiler verifies
that the message types match at build time.
In the next chapter, we’ll dissect our task to look more closely at each associated type and method in order to understand exactly what they do.
Task Anatomy: Types and Methods
Now that you’ve seen the three task traits, let’s look closely at the associated types and methods that make them work.
Associated Types
type Resources<'r> and impl Freezable
We’ll cover these in detail in the
Advanced Task Features chapter. For now, notice that both are
defined as empty – type Resources<'r> = () and impl Freezable for MyTask {} – which
is all you need for a simple project.
type Input<'m> (CuTask and CuSinkTask only)
#![allow(unused)]
fn main() {
type Input<'m> = input_msg!(MyPayload);
}Declares what messages this task receives from upstream. The input_msg!() macro wraps
your payload type into Copper’s message container (CuMsg<T>), which carries:
- The payload itself (your struct)
- Metadata (timestamps, status flags)
- Time of Validity (
tov)
Multiple inputs: If a task receives data from multiple upstream tasks, list the types separated by commas:
#![allow(unused)]
fn main() {
type Input<'m> = input_msg!(SensorA, SensorB);
}In process(), the input parameter becomes a tuple that you can destructure:
#![allow(unused)]
fn main() {
fn process(&mut self, _ctx: &CuContext, input: &Self::Input<'_>, ...) -> CuResult<()> {
let (sensor_a_msg, sensor_b_msg) = *input;
// Use sensor_a_msg.payload() and sensor_b_msg.payload()
Ok(())
}
}type Output<'m> (CuSrcTask and CuTask only)
#![allow(unused)]
fn main() {
type Output<'m> = output_msg!(MyPayload);
}Declares what messages this task produces for downstream. The output buffer is
pre-allocated by the runtime at startup. You don’t create messages – you fill them
using set_payload().
Methods
fn new(config, resources) -> CuResult<Self>
#![allow(unused)]
fn main() {
fn new(
_config: Option<&ComponentConfig>,
_resources: Self::Resources<'_>,
) -> CuResult<Self>
where
Self: Sized,
{
Ok(Self {})
}
}The constructor. Called once when the runtime builds the task graph.
config: Option<&ComponentConfig> is a key-value map from the task’s config block
in copperconfig.ron. For example, if your RON file has:
(
id: "motor",
type: "tasks::MotorDriver",
config: { "pin": 4, "max_speed": 1.0 },
),
You can read the values in new():
#![allow(unused)]
fn main() {
fn new(config: Option<&ComponentConfig>, _resources: Self::Resources<'_>) -> CuResult<Self> {
let cfg = config.ok_or("MotorDriver requires a config block")?;
let pin: u8 = cfg
.get::<u8>("pin")?
.ok_or_else(|| CuError::from("MotorDriver missing `pin`"))?;
let max_speed: f64 = cfg
.get::<f64>("max_speed")?
.ok_or_else(|| CuError::from("MotorDriver missing `max_speed`"))?;
Ok(Self { pin, max_speed })
}
}We’ll discuss resources in future chapters.
fn process() – the main loop
This is where your task does its work. The runtime calls it every cycle. The signature depends on the trait:
| Trait | Signature |
|---|---|
CuSrcTask | process(&mut self, ctx, output) |
CuTask | process(&mut self, ctx, input, output) |
CuSinkTask | process(&mut self, ctx, input) |
In our simple example, the source ignores most parameters and just writes a value:
#![allow(unused)]
fn main() {
fn process(&mut self, _ctx: &CuContext, output: &mut Self::Output<'_>) -> CuResult<()> {
output.set_payload(MyPayload { value: 42 });
Ok(())
}
}Let’s look at what each parameter gives you.
Reading input
input.payload() returns Option<&T> – an Option because the message could be empty
(e.g., the upstream task had nothing to send this cycle). In production you should handle
None; in our example we just unwrap:
#![allow(unused)]
fn main() {
let value = input.payload().unwrap();
}Writing output
output.set_payload(value) writes your data into a buffer that was pre-allocated at
startup.
For values that should persist on the consumer side until explicitly replaced, Copper also has a generic latched-state pattern:
CuLatchedStateUpdate<T>::NoChange– keep the cached valueCuLatchedStateUpdate<T>::Set(value)– replace the cached valueCuLatchedStateUpdate<T>::Clear– remove the cached value
Downstream tasks can store that state in CuLatchedState<T> and apply updates as they
arrive. This is a good fit for calibration bundles, static transforms, lookup tables, and
other low-rate metadata that should not be rebuilt every cycle. The full producer and
consumer pattern is covered in Defining Messages.
The context: &CuContext
Every lifecycle callback receives a ctx parameter of type &CuContext. It dereferences
to Copper’s monotonic RobotClock, so ctx.now() gives you the current Copper time, and
it also carries runtime metadata such as ctx.cl_id(), ctx.instance_id(), and the
currently executing task ID.
ctx.now() returns a CuTime (a u64 of nanoseconds since startup). There is no UTC or
wall-clock in Copper; tasks should never call std::time::SystemTime::now() or
std::time::Instant::now().
In our simple project we prefix the parameter with _ because we don’t use it. But on a
real robot you’d use it like this:
Timestamp your output (typical for source tasks):
#![allow(unused)]
fn main() {
fn process(&mut self, ctx: &CuContext, output: &mut Self::Output<'_>) -> CuResult<()> {
output.set_payload(MyPayload { value: read_sensor() });
output.tov = Tov::Time(ctx.now());
Ok(())
}
}Compute a time delta (e.g., for a PID controller):
#![allow(unused)]
fn main() {
fn process(&mut self, ctx: &CuContext, input: &Self::Input<'_>, output: &mut Self::Output<'_>) -> CuResult<()> {
let now = ctx.now();
let dt = now - self.last_time; // CuDuration in nanoseconds
self.last_time = now;
let error = self.target - input.payload().unwrap().value;
let correction = self.kp * error + self.ki * self.integral * dt.as_secs_f64();
// ...
Ok(())
}
}Detect a timeout:
#![allow(unused)]
fn main() {
fn process(&mut self, ctx: &CuContext, input: &Self::Input<'_>) -> CuResult<()> {
if input.payload().is_none() {
let elapsed = ctx.now() - self.last_seen;
if elapsed > CuDuration::from_millis(100) {
debug!("Sensor timeout! No data for {}ms", elapsed.as_millis());
}
}
Ok(())
}
}Why not use the system clock? Because Copper supports deterministic replay. When
you replay a recorded run, the runtime feeds your tasks the exact same clock values from
the original recording. If you used std::time, the replay would have different
timestamps and your tasks would behave differently. With CuContext (and its underlying
RobotClock), same clock + same inputs = same outputs, every time.
The golden rule of process()
Because process() runs on the real-time critical path (potentially thousands of
times per second), you should avoid heap allocation inside it. Operations like
Vec::push(), String::from(), or Box::new() ask the system allocator for memory,
which can take an unpredictable amount of time and cause your cycle to miss its deadline.
Copper’s architecture is designed so you never need to allocate in process(): messages
are pre-allocated, and the structured logger writes to pre-mapped memory. Keep your
process() fast and predictable.
So far we’ve focused on new() and process() – the two methods you’ll always
implement. But Copper tasks have a richer lifecycle with optional hooks for setup,
teardown, and work that doesn’t need to run on the critical path. Let’s look at that next.
Task Lifecycle
Beyond new() and process(), Copper tasks have a full lifecycle with optional hooks for
setup, teardown, and non-critical work. Understanding this lifecycle helps you put the
right code in the right place.
The full lifecycle
new() → start() → [ preprocess() → process() → postprocess() ] → stop()
└──────────── repeats every cycle ────────────┘
Lifecycle methods
| Method | When | Thread | What to do here |
|---|---|---|---|
new() | Once, at construction | Main | Read config, initialize state |
start() | Once, before the first cycle | Main | Open file handles, initialize hardware, allocate buffers |
preprocess() | Every cycle, before process() | Best-effort | Heavy prep work: decompression, FFT, parsing |
process() | Every cycle | Critical path | Core logic. Keep it fast. No allocations. |
postprocess() | Every cycle, after process() | Best-effort | Telemetry, non-critical logging, statistics |
stop() | Once, after the last cycle | Main | Cleanup: close files, stop hardware, free resources |
The two threads
Copper splits each cycle across two execution contexts:
Critical path thread
This is where process() runs. Tasks execute back-to-back in the order determined by
the task graph topology. The runtime minimizes latency and jitter on this thread. You must
avoid allocations, system calls, and anything that could block.
Best-effort thread
This is where preprocess() and postprocess() run. The runtime schedules these to
minimize interference with the critical path. You can safely do heavier work here:
I/O, allocations, logging, network calls.
What if preprocess() is late?
The critical path never waits for the best-effort thread. If preprocess() takes
longer than expected and hasn’t finished when the critical path is ready, process() runs
anyway – with whatever data is available from the previous cycle (or nothing, if it’s the
first one).
This is intentional: in a real-time system, a late result is a wrong result. It’s better
to run your control loop on slightly stale data than to miss a deadline. Your process()
should handle this gracefully:
#![allow(unused)]
fn main() {
fn preprocess(&mut self, _ctx: &CuContext) -> CuResult<()> {
// Heavy work on the best-effort thread -- might be slow
self.decoded_image = Some(decode_jpeg(&self.raw_buffer));
Ok(())
}
fn process(&mut self, _ctx: &CuContext, input: &Self::Input<'_>,
output: &mut Self::Output<'_>) -> CuResult<()> {
// Use whatever is ready. If preprocess was late, decoded_image
// still holds the previous cycle's result (or None on first cycle).
if let Some(ref image) = self.decoded_image {
output.set_payload(run_inference(image));
}
Ok(())
}
}The same applies to postprocess(): if it falls behind, the next cycle’s process()
still runs on time.
Example: when to use each method
Imagine an IMU driver task:
new() → Read the SPI bus config from ComponentConfig
start() → Open the SPI device, configure the sensor registers
preprocess() → (not needed for this task)
process() → Read raw bytes from SPI, convert to ImuReading, set_payload()
postprocess() → Log statistics (sample rate, error count)
stop() → Close the SPI device
Or a computer vision task:
new() → Load the model weights
start() → Initialize the inference engine
preprocess() → Decode the JPEG image from the camera (heavy, OK on best-effort thread)
process() → Run inference on the decoded image, output detections
postprocess() → Update FPS counter, send telemetry
stop() → Release GPU resources
All lifecycle methods are optional
new() and process() are required – everything else has a default no-op implementation.
You only implement the lifecycle methods you need:
#![allow(unused)]
fn main() {
impl CuTask for MyTask {
type Resources<'r> = ();
type Input<'m> = input_msg!(MyPayload);
type Output<'m> = output_msg!(MyPayload);
// Required: constructor
fn new(_config: Option<&ComponentConfig>, _resources: Self::Resources<'_>) -> CuResult<Self>
where Self: Sized {
Ok(Self {})
}
// Required: core logic
fn process(&mut self, _ctx: &CuContext, input: &Self::Input<'_>,
output: &mut Self::Output<'_>) -> CuResult<()> {
// your core logic
Ok(())
}
// Optionally implement any of these:
// fn start(&mut self, ctx: &CuContext) -> CuResult<()> { ... }
// fn stop(&mut self, ctx: &CuContext) -> CuResult<()> { ... }
// fn preprocess(&mut self, ctx: &CuContext) -> CuResult<()> { ... }
// fn postprocess(&mut self, ctx: &CuContext) -> CuResult<()> { ... }
}
}Freeze and thaw (state snapshots)
Copper automatically logs every message flowing between tasks. But messages alone aren’t enough to reproduce a task’s behavior – you also need its internal state.
Consider a PID controller that accumulates error over time. If you want to replay from minute 7 of a 10-minute run to debug a crash, you need to know what the accumulated error was at minute 7. Without state snapshots, you’d have to replay from the very start and wait 7 minutes to get there.
That’s what freeze and thaw solve. The Freezable trait gives each task two hooks:
freeze()– Save the task’s internal state. Called periodically by the runtime to create “keyframes.”thaw()– Restore the task’s state from a saved snapshot.
These are not part of the per-cycle loop. They run at a much lower rate and are independent of the critical path:
┌─── cycle ───┐ ┌─── cycle ───┐ ┌─── cycle ───┐
... ─── process() ─── process() ─── ... ─── process() ─── ...
│ │
freeze() freeze()
(keyframe) (keyframe)
Think of it like a video codec: process() runs every frame, while freeze() saves a
keyframe at a low rate. During replay, the runtime jumps to the nearest keyframe before
minute 7, restores every task’s state via thaw(), and replays from there – no need to
start from the beginning.
For stateless tasks (like our simple MySource, MyTask, MySink), the empty
impl Freezable is fine – there’s nothing to snapshot. We’ll cover how to implement
freeze and thaw for stateful tasks in the
Advanced Task Features chapter.
The Remaining Files and Running
We’ve covered copperconfig.ron and tasks.rs – the two files you’ll edit most. Now
let’s look at main.rs, build.rs, and the relevant Cargo.toml bits. These are mostly
boilerplate that you write once and rarely touch. We’ll come back to logreader.rs in
Logging and Replaying Data and replay via resim.rs later.
main.rs – the entry point
pub mod tasks;
use cu29::prelude::*;
use std::path::Path;
use std::thread::sleep;
use std::time::Duration;
const PREALLOCATED_STORAGE_SIZE: Option<usize> = Some(1024 * 1024 * 100);
#[copper_runtime(config = "copperconfig.ron")]
struct MyProjectApplication {}
fn main() {
let logger_path = "logs/my-project.copper";
if let Some(parent) = Path::new(logger_path).parent() {
if !parent.exists() {
std::fs::create_dir_all(parent).expect("Failed to create logs directory");
}
}
debug!("Logger created at {}.", logger_path);
debug!("Creating application... ");
let mut application = MyProjectApplication::builder()
.with_log_path(logger_path, PREALLOCATED_STORAGE_SIZE)
.expect("Failed to setup logger.")
.build()
.expect("Failed to create application.");
debug!("Running... starting clock: {}.", application.clock().now());
application.run().expect("Failed to run application.");
debug!("End of program: {}.", application.clock().now());
sleep(Duration::from_secs(1));
}Here’s what each part does:
pub mod tasks; – Brings in your tasks.rs. The task types you defined there
(e.g., tasks::MySource) are what copperconfig.ron references.
#[copper_runtime(config = "copperconfig.ron")] – The key macro. At compile time,
it reads your config file, parses the task graph, computes a topological execution order,
and generates a custom runtime struct with a deterministic scheduler. It also creates a
builder struct named MyProjectApplicationBuilder. The struct itself is empty – all the
generated code is injected by the macro.
PREALLOCATED_STORAGE_SIZE – How much memory (in bytes) to pre-allocate for the
structured log. 100 MB is a reasonable default.
MyProjectApplication::builder() – Creates the generated application builder.
You provide the pieces you want to override, such as the clock, config override, or
resource factory.
.with_log_path(...).build() – Wires
everything together: creates each task by calling their new() constructors,
pre-allocates all message buffers, and sets up the scheduler.
application.run() – Starts the deterministic execution loop. Calls start() on
all tasks, then enters the cycle loop (preprocess -> process -> postprocess for
each task, in topological order), and continues until you stop the application (Ctrl+C).
application.clock() – Returns the runtime clock handle. The builder creates a
default clock unless you override it with .with_clock(...), which is mainly useful in
tests or simulation.
build.rs – log index setup
fn main() {
println!(
"cargo:rustc-env=LOG_INDEX_DIR={}",
std::env::var("OUT_DIR").unwrap()
);
}This sets the LOG_INDEX_DIR environment variable at compile time. Copper’s logging macros
(debug!, info!, etc.) need it to generate a string index for log messages. Without it,
you’ll get:
no LOG_INDEX_DIR system variable set, be sure build.rs sets it
You never need to change this file. Just make sure it exists.
Controlling the Loop Frequency
If you’ve run our project, you noticed that the output scrolls extremely fast. That’s because by default, Copper runs the task graph as fast as possible – there’s no rate limiter. On a modern machine, that can mean hundreds of thousands of cycles per second.
In this chapter, we’ll see how fast the loop actually runs and how to set a target frequency.
How fast is it running?
Let’s modify MySource in tasks.rs to print the time at each cycle. Replace the
process() method:
#![allow(unused)]
fn main() {
fn process(&mut self, ctx: &CuContext, output: &mut Self::Output<'_>) -> CuResult<()> {
debug!("Source at {}µs", ctx.now().as_micros());
output.set_payload(MyPayload { value: 42 });
Ok(())
}
}Run the project and look at the timestamps:
00:00:00.5296 [Debug] Source at 529632
00:00:00.5297 [Debug] Received message: 42
00:00:00.5298 [Debug] Sink Received message: 43
00:00:00.5300 [Debug] Source at 530005
00:00:00.5301 [Debug] Received message: 42
00:00:00.5302 [Debug] Sink Received message: 43
...
The values are in microseconds. The gap between two Source at ... lines is a few hundred
microseconds. Without a rate limiter, the loop runs as fast as it can – potentially
thousands of cycles per second, pegging a CPU core at 100%. Way too fast for most applications – and it will peg a CPU
core at 100%.
Setting a target frequency
Copper provides a simple way to rate-limit the execution loop. Add a runtime section to
your copperconfig.ron:
(
tasks: [
(
id: "src",
type: "tasks::MySource",
),
(
id: "t-0",
type: "tasks::MyTask",
),
(
id: "sink",
type: "tasks::MySink",
),
],
cnx: [
(
src: "src",
dst: "t-0",
msg: "crate::tasks::MyPayload",
),
(
src: "t-0",
dst: "sink",
msg: "crate::tasks::MyPayload",
),
],
runtime: (
rate_target_hz: 1,
),
)
The only change is the runtime section at the bottom. rate_target_hz: 1 tells Copper
to target 1 cycle per second (1 Hz).
Run again:
00:00:00.0005 [Debug] Source at 510
00:00:00.0005 [Debug] Received message: 42
00:00:00.0005 [Debug] Sink Received message: 43
00:00:01.0000 [Debug] Source at 1000019
00:00:01.0001 [Debug] Received message: 42
00:00:01.0001 [Debug] Sink Received message: 43
Now each full cycle (source -> task -> sink) runs once per second.
How it works
rate_target_hz acts as a rate limiter, not a scheduler. After each complete cycle,
the runtime checks how much time has elapsed. If the cycle finished faster than the target
period (e.g., under 10ms for 100 Hz), the runtime waits for the remaining time. If the
cycle took longer than the target period, the next cycle starts immediately – no time is
wasted.
This means:
- Your actual frequency is at most
rate_target_hz. - If your tasks are too slow for the target, the loop runs at whatever rate it can sustain.
- Without the
runtimesection, the loop runs flat-out with no pause between cycles.
For host-side applications that need tighter cadence at higher rates, Copper also ships an
optional high-precision-limiter crate feature. That mode keeps the same
runtime.rate_target_hz config, but the std runtime switches from pure sleep-based waiting
to a hybrid sleep-then-spin limiter with absolute deadlines. It burns more CPU near each
tick, so it is meant for metronomic loops, not for the default “save cycles” use case.
Difference with ROS
In ROS, each node controls its own frequency. A camera node publishes at 30 Hz, an IMU
node publishes at 200 Hz, and a planner node runs at 10 Hz – all independently. Nodes
are loosely coupled via topics, and each one has its own rospy.Rate() or rclcpp::Rate
timer that governs how often it publishes.
Copper works differently. There is one global loop that executes the entire task graph
in sequence: source -> processing -> sink, back-to-back, in topological order. Every task
runs every cycle, as fast as possible. The rate_target_hz setting doesn’t make
individual tasks run at different speeds – it tells the runtime how long to wait
between cycles so the whole pipeline doesn’t run flat-out and peg the CPU.
ROS: Node A (30 Hz) ──┐
Node B (200 Hz) ──┼── independent timers, publish on topics
Node C (10 Hz) ──┘
Copper: [ Source → Task → Sink ] → wait → [ Source → Task → Sink ] → wait → ...
└──── one cycle ────────┘ └──── one cycle ────────┘
global rate_target_hz
The key insight: in Copper, all tasks share the same cadence. If you need different parts of your system to run at different rates (e.g., a fast inner control loop and a slow planner), you’d use separate task graphs or implement logic inside a task to skip cycles. But for most applications, a single frequency for the whole pipeline is simpler and avoids the synchronization headaches that come with multiple independent timers.
Adding the Console Monitor
In the previous chapter we controlled the loop frequency. But how do we know how fast each
task actually runs? How much time does process() take? What’s the jitter?
Copper comes with a built-in TUI (terminal user interface) monitor called CuConsoleMon that displays live statistics for every task in your pipeline – mean execution time, standard deviation, min, max, and more.
Step 1: Add the dependency
Add cu-consolemon to your Cargo.toml next to your existing Copper dependencies.
The only new dependency is cu-consolemon.
If your project already uses Copper through git or local path dependencies, keep that
same source style and add cu-consolemon from the same Copper release. If you use
crates.io, use the same published Copper release as your existing cu29 dependency.
Step 2: Enable it in copperconfig.ron
Add a monitor section to your copperconfig.ron:
(
tasks: [
(
id: "src",
type: "tasks::MySource",
),
(
id: "t-0",
type: "tasks::MyTask",
),
(
id: "sink",
type: "tasks::MySink",
),
],
cnx: [
(
src: "src",
dst: "t-0",
msg: "crate::tasks::MyPayload",
),
(
src: "t-0",
dst: "sink",
msg: "crate::tasks::MyPayload",
),
],
runtime: (
rate_target_hz: 1,
),
monitor: (
type: "cu_consolemon::CuConsoleMon",
),
)
Step 3: Run
cargo run
Instead of the scrolling debug output you’re used to, you’ll see a live terminal dashboard that takes over your terminal. Navigate to the latency tab (you can click on it)
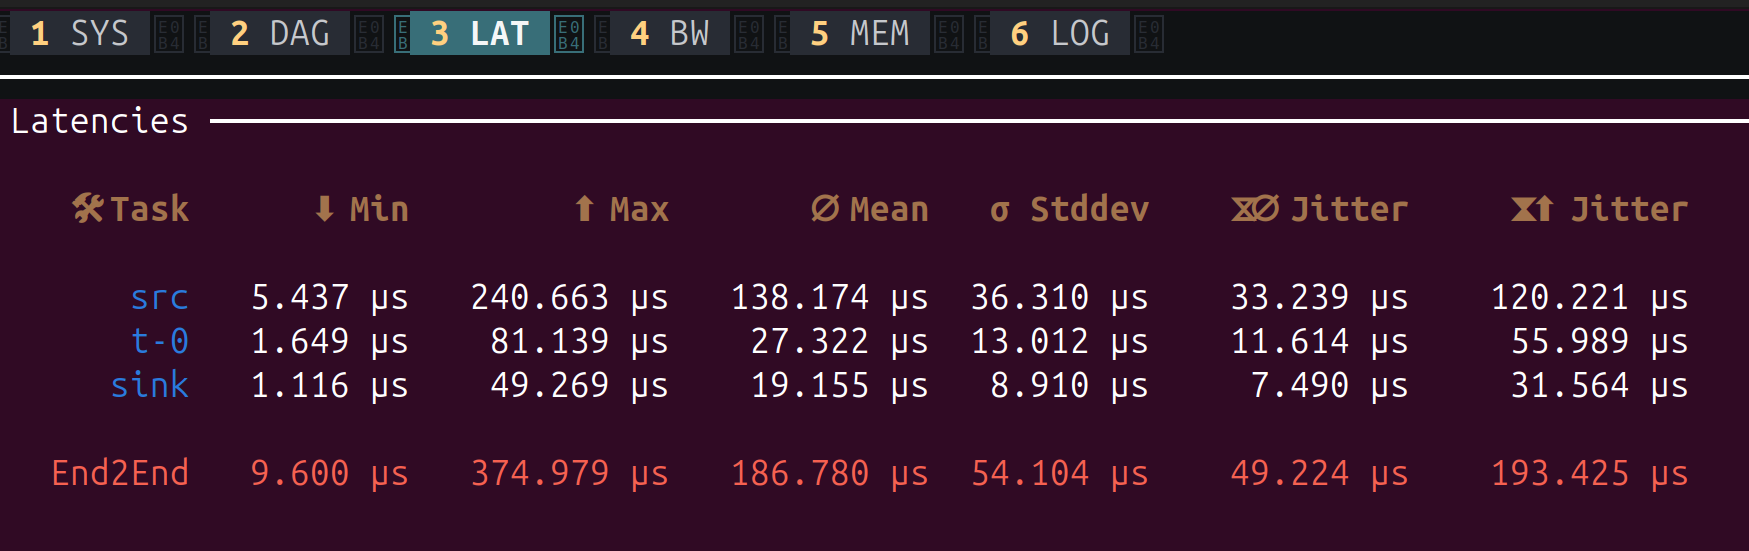
The latency tab shows one row per task, plus an End2End row at the bottom for the entire pipeline. Here’s what each column means:
| Column | Meaning |
|---|---|
| Task | The task id from your copperconfig.ron |
| Min | Fastest process() execution seen across all cycles |
| Max | Slowest process() execution seen (watch for spikes here) |
| Mean | Average process() execution time |
| Stddev | Standard deviation – how much the execution time varies. Lower is more predictable |
| Jitter (mean) | Average difference between consecutive cycle times. Indicates how stable the timing is |
| Jitter (max) | Worst-case jitter seen. A large value means occasional timing spikes |
The End2End row measures the full pipeline latency: from the start of src to the end
of sink. In our example, the entire pipeline completes in about 187 µs on average, with
a worst case of 375 µs.
This is extremely useful for:
- Verifying your frequency: Are your tasks fast enough for the target
rate_target_hz? - Finding bottlenecks: Which task takes the most time?
- Detecting jitter: A high Std Dev means unpredictable execution time, which could be a problem for real-time control.
Difference with ROS
In ROS 2, getting this kind of per-node timing data typically requires external tools like
ros2 topic hz, ros2 topic delay, or hooking up a tracing framework. Each tool gives
you one metric at a time, for one topic.
In Copper, the console monitor is built into the runtime. One line of config gives you a live dashboard of every task in the system, with no external tooling needed.
Press Ctrl+C to stop the application as usual.
The other tabs
The monitor has six tabs, accessible by pressing 1 through 6 or clicking on them.
1 - SYS: System Info
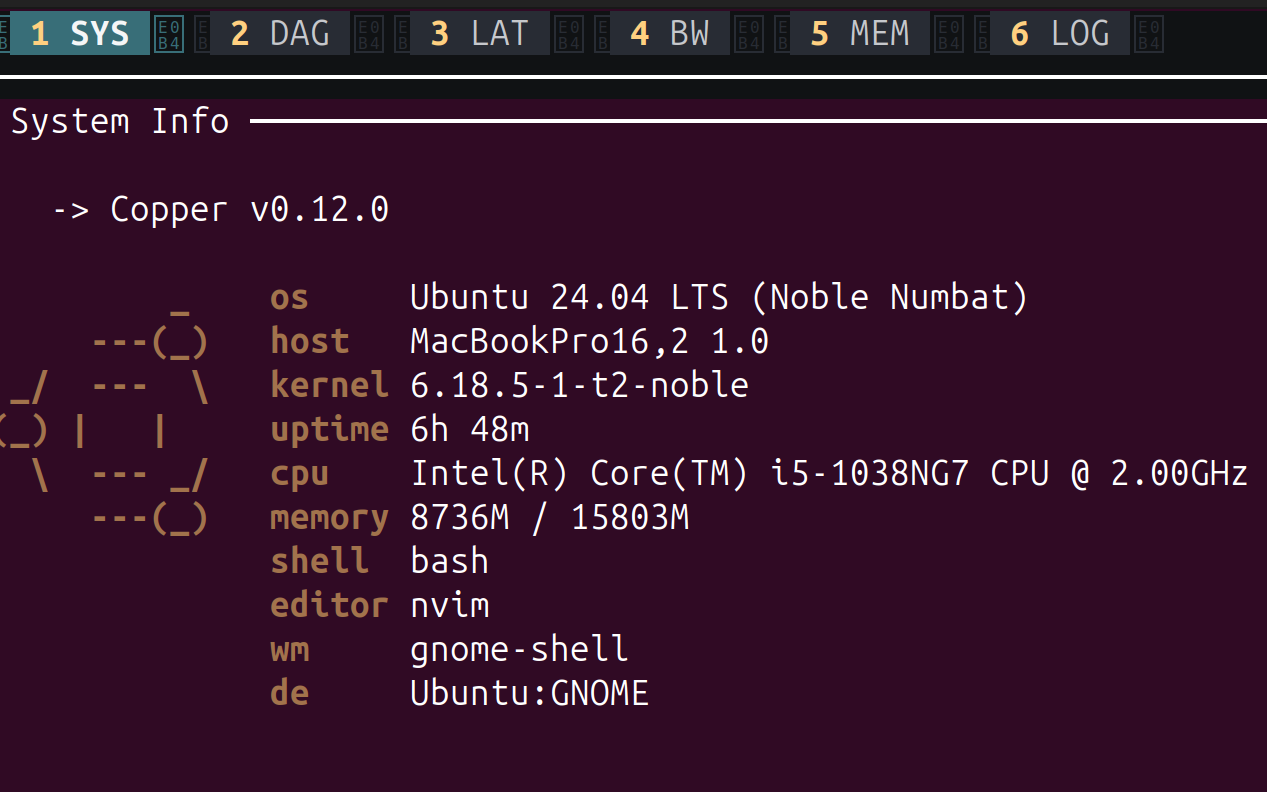
Displays your system information: OS, kernel, CPU, memory, and the Copper version. Useful for documenting what hardware a recording was made on.
2 - DAG: Task Graph
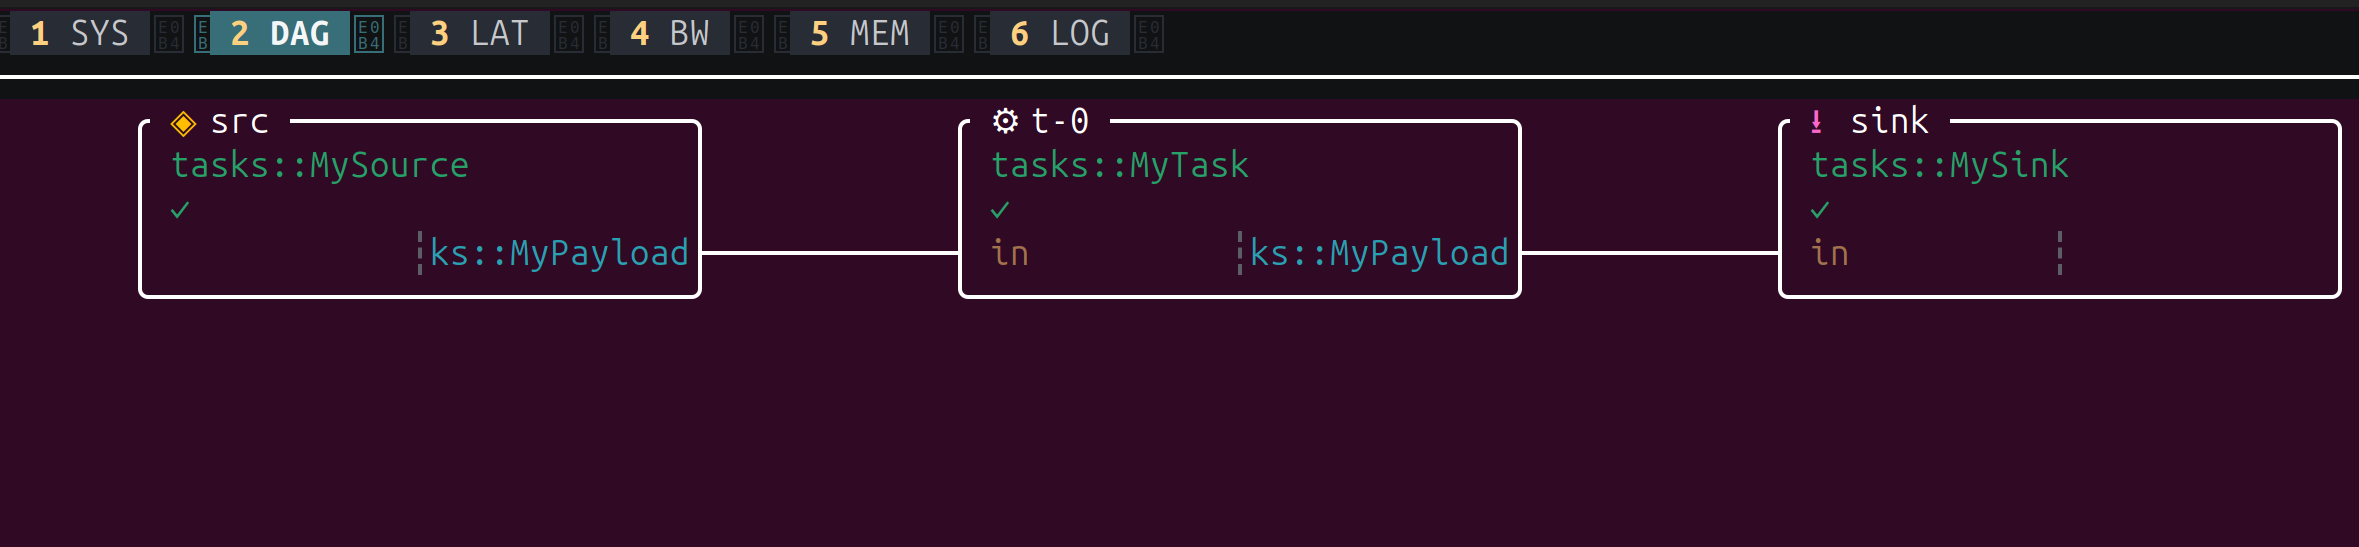
A visual representation of your task graph. Each box is a task, showing its id, Rust
type, and the message types on its connections. This is your copperconfig.ron rendered
live – a quick way to verify the pipeline is wired correctly.
4 - BW: Bandwidth
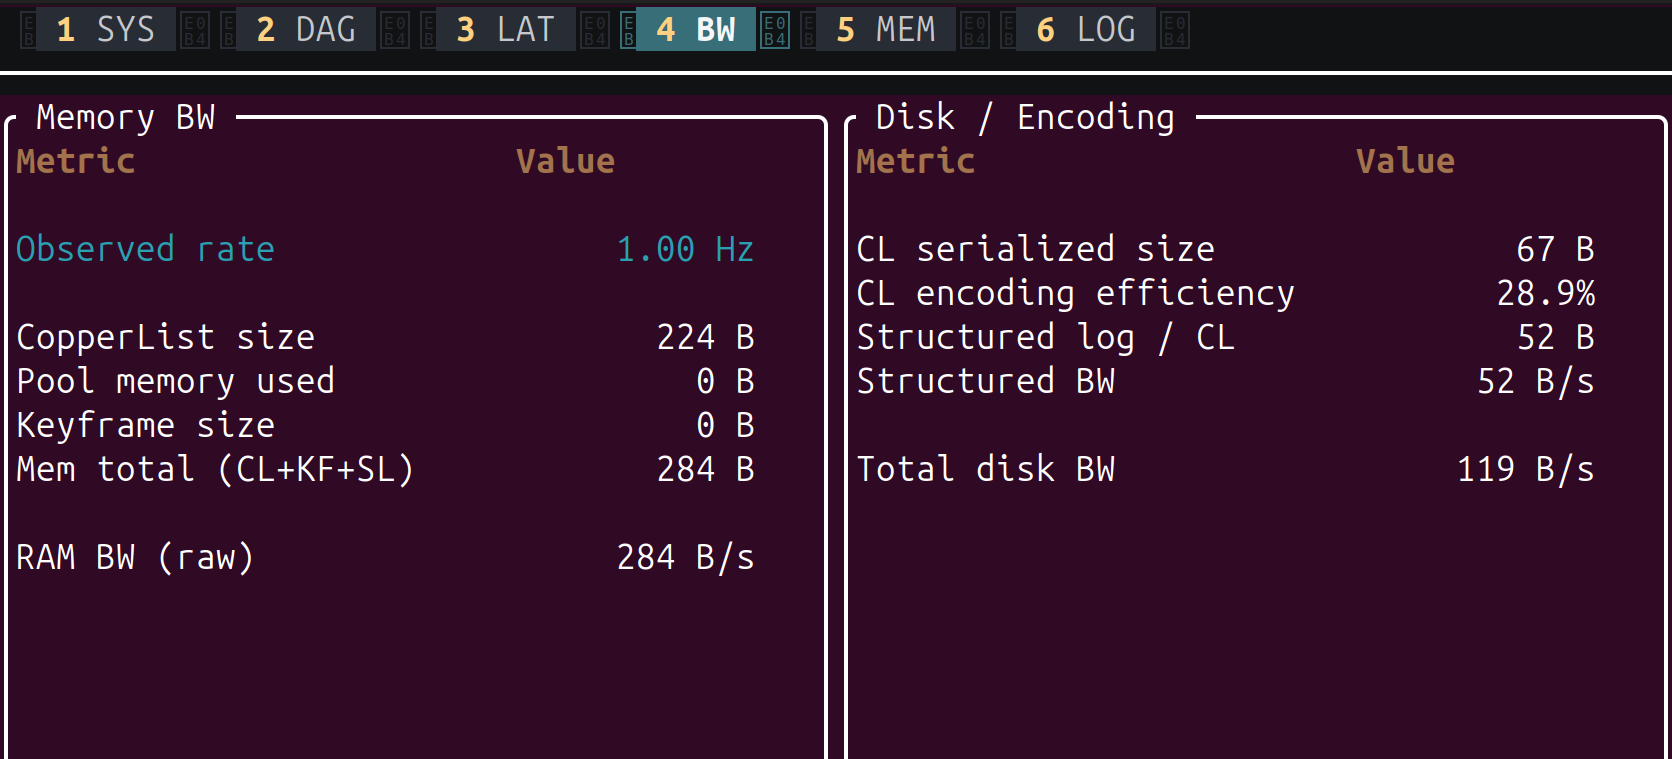
Shows memory and disk bandwidth consumed by the runtime. The left panel (Memory BW) reports the observed loop rate, CopperList size, and raw memory throughput. The right panel (Disk / Encoding) shows the serialized size of each CopperList, encoding efficiency, structured log bandwidth, and total disk write rate. Useful for sizing your log storage and checking that the logger can keep up.
5 - MEM: Memory Pools
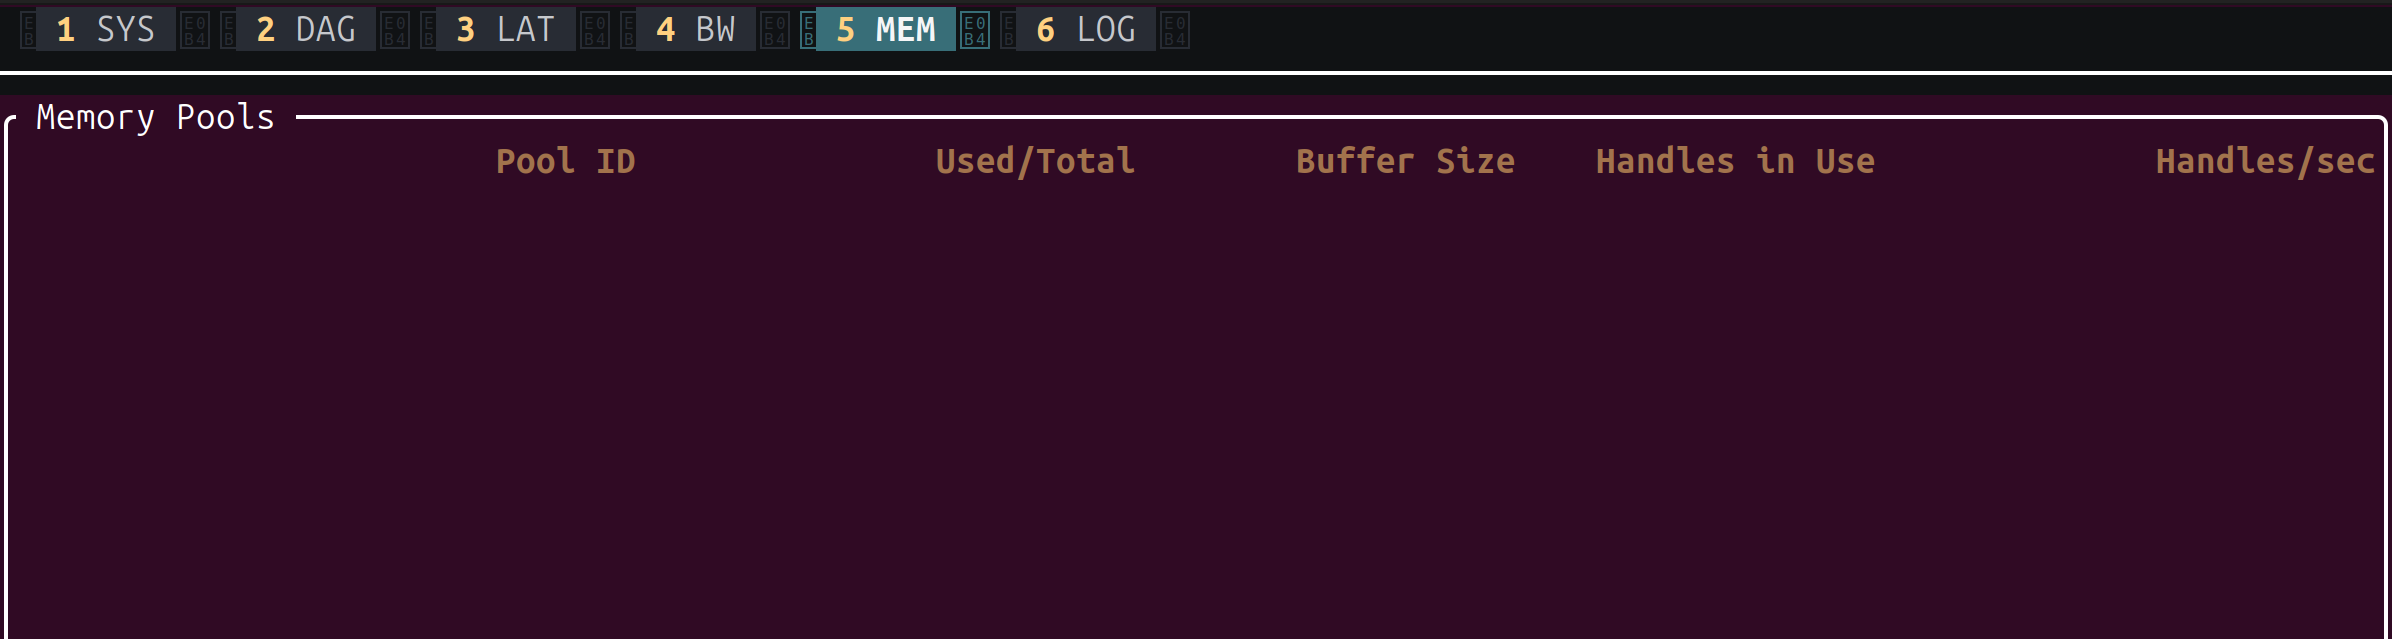
Displays the status of Copper’s pre-allocated memory pools: pool ID, used vs total buffers, buffer size, handles in use, and allocation rate. In our simple project the pools are empty, but on a real robot with large messages (images, point clouds), this helps you verify that buffers are correctly sized and not exhausted.
6 - LOG: Debug Output
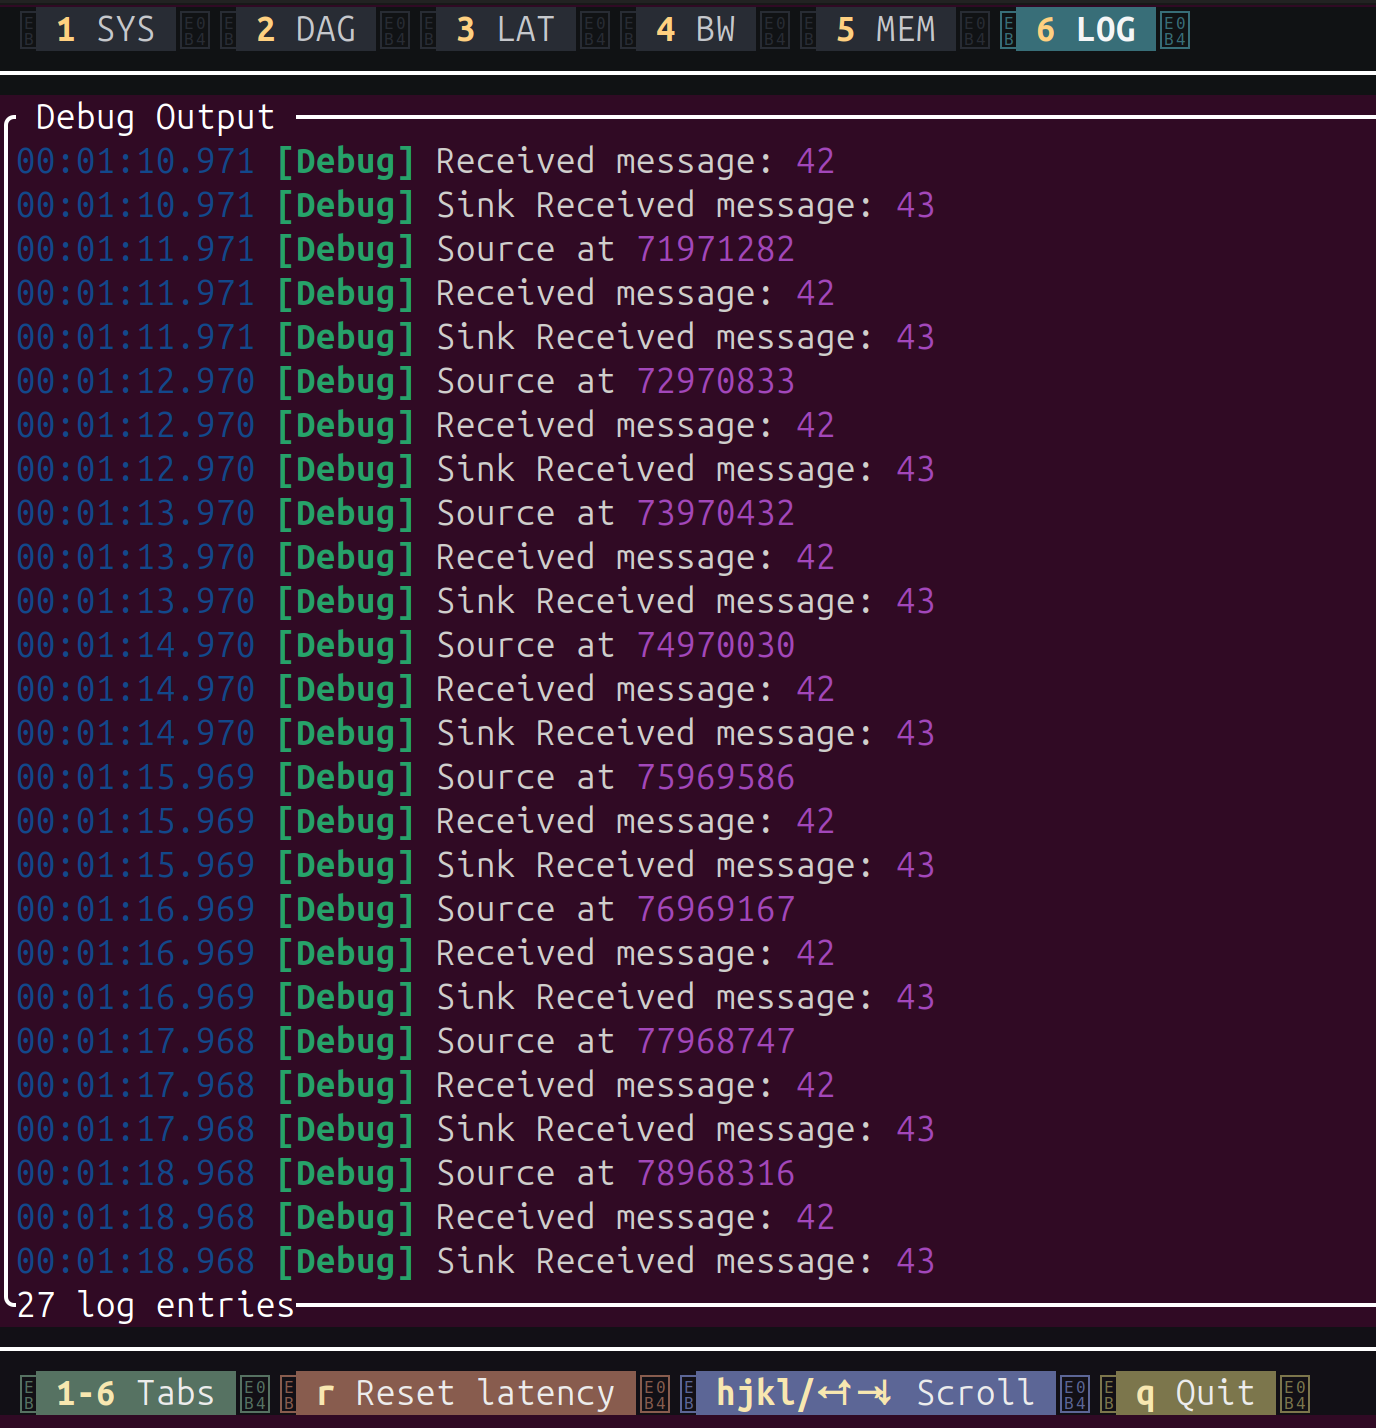
A scrollable view of all debug!() log output from your tasks – the same messages you’d
see without the monitor, but captured inside the TUI. You can scroll through the history
with hjkl or arrow keys. The bottom bar also shows keyboard shortcuts: r to reset
latency statistics, q to quit.
Logging and Replaying Data
Every time you’ve run our project so far, Copper has been quietly recording everything.
Look at main.rs – the generated app builder’s .with_log_path(...) call initializes a unified logger
that writes to logs/my-project.copper. Every cycle, the runtime serializes every message
exchanged between tasks (the CopperList) and writes it to that file.
In this chapter, we’ll explore what’s in that log file, how to read it back, and how to replay recorded data through the pipeline.
What gets logged?
Copper’s unified logger captures two kinds of data in a single .copper file:
-
Structured text logs – Every
debug!(),info!(),warn!(), anderror!()call from your tasks. These are stored in an efficient binary format (not as text strings), so they’re extremely fast to write and compact on disk. -
CopperList data – The complete set of message payloads exchanged between tasks in each cycle. In our project, that means every
MyPayload { value: 42 }fromMySourceand everyMyPayload { value: 43 }fromMyTask, along with precise timestamps.
This is different from most robotics frameworks where logging is opt-in and you have to explicitly record topics. In Copper, every message is logged by default. The runtime does this automatically as part of its execution loop – no extra code needed.
Step 1: Generate a log file
Make sure your project is in the state from the previous chapters, with the 1 Hz rate
limiter. Here’s the copperconfig.ron for reference:
(
tasks: [
(
id: "src",
type: "tasks::MySource",
),
(
id: "t-0",
type: "tasks::MyTask",
),
(
id: "sink",
type: "tasks::MySink",
),
],
cnx: [
(
src: "src",
dst: "t-0",
msg: "crate::tasks::MyPayload",
),
(
src: "t-0",
dst: "sink",
msg: "crate::tasks::MyPayload",
),
],
runtime: (
rate_target_hz: 1,
),
)
Note: If you still have the
monitorsection from the previous chapter, remove it for now. The console monitor takes over the terminal and makes it harder to see the debug output.
Run the project and let it execute for 5-10 seconds, then press Ctrl+C:
cargo run
00:00:03.9986 [Debug] Received message: 42
00:00:03.9987 [Debug] Sink Received message: 43
00:00:04.9979 [Debug] Source at 4997916
00:00:04.9980 [Debug] Received message: 42
00:00:04.9981 [Debug] Sink Received message: 43
...
After stopping, check the logs/ directory:
ls -lh logs/
-rw-r--r-- 1 user user 4.0K logs/my-project.copper
That .copper file contains everything: every message, every timestamp, every debug line.
Note: The log path is hardcoded to
"logs/my-project.copper"inmain.rs. Each run overwrites the previous log file – there is no automatic rotation or timestamping. If you want to keep a log from a previous session, rename or move the file before running the project again.
Step 2: The log reader
If you look at your project, you’ll notice there’s already a file you haven’t used yet:
src/logreader.rs. The project template ships with a built-in log reader. Let’s look at
it:
pub mod tasks;
use cu29::prelude::*;
use cu29_export::run_cli;
// This will create the CuStampedDataSet that is specific to your copper project.
// It is used to instruct the log reader how to decode the logs.
gen_cumsgs!("copperconfig.ron");
#[cfg(feature = "logreader")]
fn main() {
run_cli::<CuStampedDataSet>().expect("Failed to run the export CLI");
}This is a small but powerful program. Let’s break it down:
gen_cumsgs!("copperconfig.ron") – This macro reads your task graph and generates a
CuStampedDataSet type that knows the exact message types used in your pipeline. The log
reader needs this to decode the binary data in the .copper file – without it, the bytes
would be meaningless.
run_cli::<CuStampedDataSet>() – This is Copper’s built-in export CLI. It provides
several subcommands for extracting data from .copper files. By passing the generated
CuStampedDataSet type, you tell it exactly how to decode your project’s messages.
#[cfg(feature = "logreader")] – The log reader is gated behind a Cargo feature flag
so its dependencies (like cu29-export) are only compiled when you actually need them.
Step 3: Extract text logs
The first thing you can do with the log reader is extract the structured text logs – the
debug!() messages from your tasks. Remember, these aren’t stored as text in the
.copper file; they’re stored as compact binary indices. The log reader reconstructs the
human-readable text using the string index that was built at compile time.
Run:
cargo run --features logreader --bin my-project-logreader -- \
logs/my-project.copper extract-text-log target/debug/cu29_log_index
The arguments are:
logs/my-project.copper– The log file to readextract-text-log– The subcommand to extract text logstarget/debug/cu29_log_index– The path to the string index directory (generated during compilation bybuild.rs)
You’ll see output like:
25.501 µs [Debug]: Logger created at logs/my-project.copper.
45.903 µs [Debug]: Creating application...
64.282 µs [Debug]: CuConfig: Reading configuration from file: copperconfig.ron
669.067 µs [Debug]: Running... starting clock: 666.866 µs.
823.766 µs [Debug]: Source at 822
870.122 µs [Debug]: Received message: 42
887.054 µs [Debug]: Sink Received message: 43
1.000 s [Debug]: Source at 1000206
1.000 s [Debug]: Received message: 42
1.000 s [Debug]: Sink Received message: 43
2.000 s [Debug]: Source at 1999631
...
This is the same output you saw scrolling by when the application was running – but reconstructed from the binary log after the fact.
Step 4: Extract CopperLists
The more interesting subcommand extracts the CopperList data – the actual message payloads from every cycle:
cargo run --features logreader --bin my-project-logreader -- \
logs/my-project.copper extract-copperlists
The output is JSON by default. Here’s what the first CopperList looks like:
{
"id": 0,
"state": "BeingSerialized",
"msgs": [
{
"payload": {
"value": 42
},
"tov": "None",
"metadata": {
"process_time": {
"start": 822050,
"end": 867803
},
"status_txt": ""
}
},
{
"payload": {
"value": 43
},
"tov": "None",
"metadata": {
"process_time": {
"start": 869282,
"end": 885259
},
"status_txt": ""
}
}
]
}
Every message from every cycle is there, exactly as it was produced. Each entry in msgs
corresponds to a connection in your task graph (in order: src→t-0, then t-0→sink).
Along with the payload, you get:
metadata.process_time– The start and end timestamps (in nanoseconds) of the task’sprocess()call that produced this message. This is the same timing data the console monitor uses for its latency statistics.tov– “Time of validity”, an optional timestamp that the task can set to indicate when the data was actually captured (useful for hardware drivers with their own clocks).status_txt– An optional status string the task can set for diagnostics.
This is the raw data you’d use for offline analysis, regression testing, or replay.
Why this matters: replay
Recording data is useful for post-mortem analysis, but the real power of Copper’s logging is deterministic replay. Because every message and its timestamp is recorded, you can feed logged data back into the pipeline and reproduce the exact same execution – without any hardware.
This means you can:
- Debug without hardware: Record a session on the real robot, then replay it on your laptop to test processing logic.
- Regression test: Record a known-good session, then replay it after code changes to verify the pipeline still produces the same results.
- Analyze edge cases: When your robot encounters an unusual situation, the log captures it. You can replay that exact moment over and over while you debug.
The key insight is that all downstream tasks don’t know the difference – they receive
the same MyPayload messages with the same timestamps, whether they come from live
hardware or a log file.
How the unified logger works under the hood
Copper’s logger is designed for zero-impact logging on the critical path. Here’s how:
-
Pre-allocated memory slabs – At startup,
.with_log_path(...)allocates a large contiguous block of memory (controlled byPREALLOCATED_STORAGE_SIZE– 100 MB in our project). CopperLists are written into this pre-allocated buffer without any dynamic allocation. -
Binary serialization – Messages are serialized using
bincode, not formatted as text. This is why your payloads need theEncode/Decodederives. Binary serialization is orders of magnitude faster thanformat!()orserde_json. -
Memory-mapped I/O – The pre-allocated slabs are memory-mapped to the
.copperfile. The OS handles flushing to disk asynchronously, so the robot’s critical path never blocks on disk I/O. -
Structured text logging – Even
debug!()calls don’t format strings at runtime. Instead, Copper stores a compact index and the raw values. The actual string formatting happens only when you read the log – not when you write it. This is why thebuild.rssets upLOG_INDEX_DIR– it’s building a string table at compile time.
This means logging in Copper is almost free on the hot path. You can log everything without worrying about performance – which is exactly why it logs everything by default.
Controlling what gets logged
Sometimes you don’t want to log everything. A high-frequency sensor producing megabytes per second can fill up your log storage quickly. Copper provides two ways to control this:
Per-task logging control
In copperconfig.ron, you can disable logging for specific tasks:
(
    id: "fast-sensor",
    type: "tasks::HighRateSensor",
    logging: (enabled: false),
),
This stops the runtime from recording that task’s output messages in the CopperList log. The task still runs normally – it just doesn’t contribute to the log file.
Global logging settings
The logging section in copperconfig.ron lets you tune the logger globally:
logging: (
slab_size_mib: 1024,
section_size_mib: 100,
),
Difference with ROS
In ROS, data recording is a separate tool: rosbag2. You start a ros2 bag record
process alongside your running nodes, tell it which topics to subscribe to, and it saves
messages into a SQLite database or MCAP file. Replay is done with ros2 bag play, which
republishes the messages on the same topics.
ROS:
Run: ros2 launch my_robot.launch.py
Record: ros2 bag record /camera /imu /cmd_vel ← separate process
Replay: ros2 bag play my_bag/ ← republishes on topics
Copper:
Run: cargo run ← logging is automatic
Read: cargo run --features logreader --bin my-project-logreader ...
Replay: feed CopperLists back into the pipeline ← deterministic
Key differences:
| ROS 2 (rosbag2) | Copper (unified logger) | |
|---|---|---|
| Opt-in vs automatic | You must explicitly record topics | Everything is logged by default |
| Separate process | ros2 bag record runs alongside | Built into the runtime – zero config |
| Format | SQLite / MCAP | Custom binary .copper format |
| Performance impact | Adds subscriber overhead per topic | Near-zero – pre-allocated, memory-mapped |
| Replay mechanism | Republishes on topics | Feed CopperLists directly into tasks |
| Deterministic | Timing depends on DDS, not guaranteed | Timestamps are recorded, replay is deterministic |
| Text logging | Separate (rosout, spdlog) | Unified – text and data in one file |
The biggest philosophical difference: in ROS, recording is something you do. In Copper,
recording is something that happens. You don’t configure it, you don’t start it, you
don’t choose which topics to record. The runtime records everything, always. You only need
to decide what to exclude (via logging: (enabled: false)) if storage is a concern.
This “record everything by default” approach is what makes Copper’s deterministic replay possible. Since every message and every timestamp is captured automatically, you can always go back and reproduce any moment of your robot’s execution.
Missions
So far, our project has a single pipeline: MySource → MyTask → MySink. Every time we
run it, the same three tasks execute in the same order. But real-world robots often need
to operate in different modes – a drone might have a “takeoff” mode and a “cruise”
mode, a warehouse robot might switch between “navigate” and “charge”, or you might want
a “simulation” mode that uses mock drivers instead of real hardware.
In many frameworks, you’d handle this with if statements scattered across your code, or
by maintaining separate launch files. Copper takes a different approach: missions.
What are missions?
A mission is a named variant of your task graph. You declare all possible tasks and
connections in a single copperconfig.ron, then tag each one with the missions it belongs
to. At build time, Copper generates a separate application builder for each mission. At
runtime, you choose which builder to use.
The key properties:
- Tasks without a
missionsfield are shared – they exist in every mission. - Tasks with a
missionsfield are selective – they only exist in the listed missions. - Connections follow the same rule – tag them with
missionsto make them mission-specific. - No recompilation needed to switch – all missions are compiled at once. You pick which one to run.
Step 1: Define missions in copperconfig.ron
Let’s modify our project to support two missions:
- “normal” – The full pipeline we’ve been using: source → processing → sink.
- “direct” – A shortcut that skips the processing task: source → sink.
This is a simple but realistic scenario. Imagine MyTask does some expensive computation
(image processing, path planning). During testing or in a degraded mode, you might want to
bypass it and send raw data straight to the sink.
Replace your copperconfig.ron with:
(
missions: [(id: "normal"), (id: "direct")],
tasks: [
(
id: "src",
type: "tasks::MySource",
),
(
id: "t-0",
type: "tasks::MyTask",
missions: ["normal"],
),
(
id: "sink",
type: "tasks::MySink",
),
],
cnx: [
(
src: "src",
dst: "t-0",
msg: "crate::tasks::MyPayload",
missions: ["normal"],
),
(
src: "t-0",
dst: "sink",
msg: "crate::tasks::MyPayload",
missions: ["normal"],
),
(
src: "src",
dst: "sink",
msg: "crate::tasks::MyPayload",
missions: ["direct"],
),
],
runtime: (
rate_target_hz: 1,
),
)
Let’s break down what changed:
The missions declaration
missions: [(id: "normal"), (id: "direct")],
This top-level array declares all available missions. Each mission is just an ID – a string that you’ll reference elsewhere.
Shared tasks
src and sink have no missions field. This means they participate in every
mission. They are the common backbone of the pipeline.
Mission-specific tasks
(
id: "t-0",
type: "tasks::MyTask",
missions: ["normal"],
),
MyTask is tagged with missions: ["normal"]. It only exists in the “normal” mission.
When running the “direct” mission, this task is simply not instantiated.
Mission-specific connections
The connections are where the graph really diverges:
Mission "normal": src ──▶ t-0 ──▶ sink
Mission "direct": src ──────────▶ sink
In “normal”, data flows through the processing task. In “direct”, the source connects
directly to the sink, bypassing MyTask entirely.
Notice that the connection src → sink in the “direct” mission uses the same message type
(crate::tasks::MyPayload) as the other connections. This works because MySink already
accepts MyPayload as input – the message types must be compatible regardless of which
path the data takes.
Step 2: Update main.rs
When you declare missions, the #[copper_runtime] macro no longer generates a single
builder. Instead, it creates a module for each mission, named after the mission ID.
Each module contains its own builder type.
For our project, the macro generates:
normal::MyProjectApplicationBuilder– builds the “normal” pipelinedirect::MyProjectApplicationBuilder– builds the “direct” pipeline
Update main.rs to select a mission:
pub mod tasks;
use cu29::prelude::*;
use std::path::Path;
use std::thread::sleep;
use std::time::Duration;
const PREALLOCATED_STORAGE_SIZE: Option<usize> = Some(1024 * 1024 * 100);
#[copper_runtime(config = "copperconfig.ron")]
struct MyProjectApplication {}
// Import the per-mission application types
use normal::MyProjectApplication as NormalApp;
use direct::MyProjectApplication as DirectApp;
fn main() {
// Pick the mission from the first command-line argument (default: "normal")
let mission = std::env::args()
.nth(1)
.unwrap_or_else(|| "normal".to_string());
let logger_path = "logs/my-project.copper";
if let Some(parent) = Path::new(logger_path).parent() {
if !parent.exists() {
std::fs::create_dir_all(parent).expect("Failed to create logs directory");
}
}
let clock = RobotClock::default();
debug!("Logger created at {}.", logger_path);
match mission.as_str() {
"normal" => {
debug!("Starting mission: normal");
let mut app = NormalApp::builder()
.with_clock(clock.clone())
.with_log_path(logger_path, PREALLOCATED_STORAGE_SIZE)
.expect("Failed to setup logger.")
.build()
.expect("Failed to create application.");
app.run().expect("Failed to run application.");
}
"direct" => {
debug!("Starting mission: direct");
let mut app = DirectApp::builder()
.with_clock(clock.clone())
.with_log_path(logger_path, PREALLOCATED_STORAGE_SIZE)
.expect("Failed to setup logger.")
.build()
.expect("Failed to create application.");
app.run().expect("Failed to run application.");
}
other => {
eprintln!("Unknown mission: '{}'. Available: normal, direct", other);
std::process::exit(1);
}
}
debug!("End of program.");
sleep(Duration::from_secs(1));
}The important changes:
- Two
usestatements import the builders from the generated mission modules. - A
matchon the mission name selects which builder to use. Here we read it from the command line, but you could also use an environment variable, a config file, or any other mechanism. - Each branch is independent – the “normal” branch builds a three-task pipeline, the “direct” branch builds a two-task pipeline.
No changes to tasks.rs are needed. The task implementations are the same – missions
only control which tasks are instantiated and wired, not how they behave.
Step 3: Run it
Run the “normal” mission (the default):
cargo run
00:00:00.0006 [Debug] Source at 630
00:00:00.0006 [Debug] Received message: 42
00:00:00.0006 [Debug] Sink Received message: 43
00:00:01.0002 [Debug] Source at 1000259
00:00:01.0004 [Debug] Received message: 42
00:00:01.0004 [Debug] Sink Received message: 43
00:00:01.9999 [Debug] Source at 1999931
00:00:02.0000 [Debug] Received message: 42
00:00:02.0001 [Debug] Sink Received message: 43
This is the full pipeline. The source produces 42, MyTask transforms it to 43, and the
sink receives 43.
Now run the “direct” mission:
cargo run -- direct
00:00:00.0005 [Debug] Source at 549
00:00:00.0005 [Debug] Sink Received message: 42
00:00:00.9999 [Debug] Source at 999945
00:00:01.0000 [Debug] Sink Received message: 42
00:00:01.9992 [Debug] Source at 1999286
00:00:01.9994 [Debug] Sink Received message: 42
00:00:02.9987 [Debug] Source at 2998704
00:00:02.9988 [Debug] Sink Received message: 42
Notice the difference: there is no “Received message: 42” line from MyTask, and the sink
receives 42 (the raw value from the source) instead of 43. MyTask was never
instantiated – the data went straight from source to sink.
Same binary, same tasks, different wiring. No recompilation.
How it works under the hood
When the #[copper_runtime] macro processes a configuration with missions, it:
- Parses all missions from the top-level
missionsarray. - For each mission, filters the task list and connection list to include only:
- Tasks/connections with no
missionsfield (shared across all missions) - Tasks/connections whose
missionsarray contains this mission’s ID
- Tasks/connections with no
- Generates a Rust module for each mission (named after the mission ID), containing a builder type, the filtered task graph, and the scheduling code.
All of this happens at compile time. The final binary contains the code for every mission, but only the tasks belonging to the selected mission are instantiated at runtime.
A task can belong to multiple missions
A task isn’t limited to a single mission. If you have a task that’s needed in several (but not all) missions, list them:
(
id: "safety-monitor",
type: "tasks::SafetyMonitor",
missions: ["navigate", "charge", "manual"],
),
This task is active in three missions but excluded from others (say, “simulation” or “diagnostics”).
When to use missions
Missions are most useful when you have:
- Hardware vs simulation: Use real drivers in one mission, mock drivers in another.
- Operating modes: Different task graphs for different phases of operation (startup, cruise, landing).
- Platform variants: The same codebase running on different hardware – one mission for the prototype with basic sensors, another for the production model with full sensor suite.
- Debug vs production: A mission with extra logging/monitoring tasks for development, and a lean mission for deployment.
Difference with ROS
In ROS 2, switching between configurations typically means maintaining separate launch files or using launch arguments with conditionals:
# ROS 2: launch file with conditionals
use_sim = LaunchConfiguration('use_sim')
Node(
package='my_robot',
executable='lidar_driver',
condition=UnlessCondition(use_sim),
),
Node(
package='my_robot',
executable='fake_lidar',
condition=IfCondition(use_sim),
),
ros2 launch my_robot robot.launch.py use_sim:=true
This works, but the logic lives in Python launch files that are completely separate from your node code. Errors (wrong topic names, missing remappings) only show up at runtime.
In Copper, all missions live in copperconfig.ron:
Copper:
copperconfig.ron ← missions, tasks, connections
cargo run ← default mission
cargo run -- direct ← alternative mission
Key differences:
| ROS 2 | Copper | |
|---|---|---|
| Where | Python launch files + YAML params | copperconfig.ron |
| Validation | Runtime (nodes may fail to connect) | Compile time (macro checks the graph) |
| Granularity | Per-node conditionals | Per-task and per-connection tagging |
| Switching | Launch arguments | Builder selection in main.rs |
| All variants visible | Spread across files and conditionals | One file, all missions visible |
The main advantage: one file shows every mission and which tasks run in each.
From Project to Workspace
In Setting Up Your Environment, we generated a single-crate project with cu_project. That flat structure
is perfect for getting started, but as your robot grows – more sensors, more algorithms,
shared components across multiple robots – a single crate with everything in tasks.rs
becomes hard to manage.
Copper provides a second template, cu_full, that scaffolds a Cargo workspace with
a clear separation between applications and reusable components. In this chapter, we’ll
generate one and understand its layout.
Generating a workspace
Use cargo-cunew with the workspace template:
cargo cunew --template workspace my_workspace
This creates a my_workspace/ directory with a full workspace layout.
What you get
my_workspace/
├── Cargo.toml # Workspace root
├── justfile # Automation helpers
├── apps/
│ └── cu_example_app/ # Your first application
│ ├── Cargo.toml
│ ├── build.rs
│ ├── copperconfig.ron
│ └── src/
│ ├── main.rs
│ ├── logreader.rs
│ ├── resim.rs
│ ├── messages.rs
│ └── tasks/
│ ├── mod.rs
│ ├── local_example_src.rs
│ ├── local_example_task.rs
│ └── local_example_sink.rs
├── components/
│ ├── bridges/
│ ├── monitors/
│ ├── payloads/
│ ├── sinks/
│ ├── sources/
│ └── tasks/
└── doc/
That’s a lot more structure than our simple my_project/. Let’s walk through it.
The workspace root: Cargo.toml
The top-level Cargo.toml defines the workspace and shared dependencies:
[workspace]
members = [
"apps/cu_example_app",
"components/bridges/cu_example_shared_bridge",
]
resolver = "2"
[workspace.dependencies]
cu29 = { path = "../../core/cu29" }
cu29-export = { path = "../../core/cu29_export" }
bincode = { package = "cu-bincode", version = "2.0", default-features = false, features = ["derive", "alloc"] }
serde = { version = "1.0", features = ["derive"] }
Every crate in the workspace references these shared dependencies with
workspace = true in its own Cargo.toml. This means you define dependency versions
once at the workspace level, and all crates stay in sync.
When you add a new application or component, you add it to the members list.
The apps/ directory
This is where your application crates live. Each app is a standalone binary that owns its own runtime configuration, log storage, logreader, and replay target.
The example app (cu_example_app) looks very similar to the my_project we built in
earlier chapters, but with two key differences.
Messages are in their own file
Instead of defining MyPayload inside tasks.rs, the workspace template puts message
types in a dedicated messages.rs:
#![allow(unused)]
fn main() {
use bincode::{Decode, Encode};
use cu29::prelude::*;
use serde::{Deserialize, Serialize};
#[derive(Default, Debug, Clone, Encode, Decode, Serialize, Deserialize, Reflect)]
pub struct MyPayload {
pub value: i32,
}
}This makes it easier to share message types – other files within the app import them
with use crate::messages::MyPayload.
Tasks are in their own directory
Instead of one big tasks.rs, each task gets its own file under src/tasks/:
src/tasks/
├── mod.rs # Re-exports all tasks
├── local_example_src.rs # MySource
├── local_example_task.rs # MyTask
└── local_example_sink.rs # MySink
The mod.rs ties them together:
#![allow(unused)]
fn main() {
mod local_example_sink;
mod local_example_src;
mod local_example_task;
pub use local_example_sink::MySink;
pub use local_example_src::MySource;
pub use local_example_task::MyTask;
}From the rest of the codebase, you still write tasks::MySource – the internal file
structure is hidden behind the module.
This is standard Rust module organization, but it matters as your robot grows. When you
have 15 tasks, having them in separate files with clear names is much easier to navigate
than scrolling through a 1000-line tasks.rs.
The copperconfig.ron is identical
The task graph configuration works exactly the same way. The only difference is that
message paths reference crate::messages::MyPayload instead of
crate::tasks::MyPayload, because the message type moved to its own module:
(
tasks: [
(
id: "src",
type: "tasks::MySource",
),
(
id: "t-0",
type: "tasks::MyTask",
),
(
id: "sink",
type: "tasks::MySink",
),
],
cnx: [
(
src: "src",
dst: "t-0",
msg: "crate::messages::MyPayload",
),
(
src: "t-0",
dst: "sink",
msg: "crate::messages::MyPayload",
),
],
)
The components/ directory
This is where reusable components live – code that can be shared across multiple applications or even published for other people to use.
The directory is organized by category:
| Directory | Purpose | Example |
|---|---|---|
sources/ | Sensor drivers that produce data | Camera driver, IMU reader |
sinks/ | Actuator drivers that consume data | Motor controller, GPIO writer |
tasks/ | Processing algorithms | PID controller, path planner |
bridges/ | Interfaces to external systems | Zenoh bridge, ROS bridge |
monitors/ | Monitoring and visualization | Console TUI, web dashboard |
payloads/ | Shared message types | Sensor payloads, spatial types |
The template generates these directories with placeholder .keep files. They’re empty,
waiting for you to add your own components as your project grows. We’ll cover how to
create shared components and how to reuse existing ones from the Copper ecosystem in the
Reusing Community Components chapter.
Where do message types go?
You might wonder: should messages go in messages.rs inside the app, or in a component
crate under components/payloads/? The answer depends on who needs them.
App-local messages stay in messages.rs inside the app. If MyPayload is only used
by the tasks within cu_example_app, it belongs right there. This is the most common case
when you’re starting out – and it’s exactly where the template puts it.
Shared messages go into a component crate when multiple apps or components need the
same type. For example, if you have two robots that both use the same sensor data format,
you’d create a crate under components/payloads/ and have both apps depend on it.
Ecosystem messages are already defined in Copper’s built-in payload crates (like
cu-sensor-payloads for common sensor types). You don’t write these – you just depend on
them. We’ll explore them in the
Reusing Community Components chapter.
Here’s the rule of thumb:
| Question | Put messages in… |
|---|---|
| Only used by tasks within one app? | apps/my_app/src/messages.rs |
| Shared between multiple apps in your workspace? | A crate under components/payloads/ |
| Already defined by an existing Copper component? | Just depend on that crate |
When in doubt, start local. You can always move a message type into a shared crate later when a second consumer appears.
Running the workspace
From the workspace root, run the example app with:
cargo run -p cu_example_app
The -p flag tells Cargo which workspace member to build and run. This is different from
the simple project where cargo run was enough – in a workspace with multiple binaries,
you need to be explicit.
Simple project vs workspace: when to switch
You don’t need to start with a workspace. Here’s a simple rule of thumb:
| Situation | Use |
|---|---|
| Learning, prototyping, single-robot projects | cu_project (simple) |
| Multiple robots sharing components | cu_full (workspace) |
| Components you want to publish or reuse | cu_full (workspace) |
| Team projects with clear module boundaries | cu_full (workspace) |
The good news: migrating from a simple project to a workspace is just moving files around
and updating Cargo.toml paths. The task code, message types, and copperconfig.ron
format are identical in both cases.
Modular Configuration
In the previous chapter we saw how a workspace separates code into multiple crates.
But what about the configuration? As your robot grows, a single copperconfig.ron with
dozens of tasks and connections becomes hard to read and maintain. What if you have two
motors that use the same driver with different parameters? You’d have to duplicate the
task entry and hope you keep them in sync.
Copper solves this with modular configuration: the ability to split your RON file into smaller pieces and compose them with parameter substitution.
The includes section
The key feature is the includes array at the top level of copperconfig.ron. Each entry
specifies a path to another RON file and an optional set of parameters:
(
tasks: [],
cnx: [],
includes: [
(
path: "sensor.ron",
params: { "id": "front", "pin": 4 },
),
],
)
When Copper processes this configuration, it reads sensor.ron, substitutes the
parameters, and merges the resulting tasks and connections into the main configuration.
Parameter substitution with {{param}}
Inside an included file, parameters are referenced using double curly braces:
// sensor.ron
(
tasks: [
(
id: "sensor_{{id}}",
type: "tasks::SensorDriver",
config: { "pin": {{pin}} },
),
],
cnx: [],
)
When included with params: { "id": "front", "pin": 4 }, this expands to:
(
tasks: [
(
id: "sensor_front",
type: "tasks::SensorDriver",
config: { "pin": 4 },
),
],
cnx: [],
)
The {{id}} becomes front and {{pin}} becomes 4. Simple text substitution –
it works in task IDs, config values, message types, or anywhere else in the RON file.
Reusing the same file with different parameters
The real power shows up when you include the same file multiple times with different parameters. This is the robotics equivalent of “instantiate the same component twice with different settings.”
Consider a robot with two motors – left and right. They use the same driver code, but different GPIO pins:
// motors.ron
(
tasks: [
(
id: "motor_{{id}}",
type: "tasks::MotorDriver",
config: { "pin": {{pin}}, "direction": "{{direction}}" },
),
],
cnx: [],
)
In your main configuration, include it twice:
(
tasks: [],
cnx: [],
includes: [
(
path: "motors.ron",
params: { "id": "left", "pin": 4, "direction": "forward" },
),
(
path: "motors.ron",
params: { "id": "right", "pin": 5, "direction": "reverse" },
),
],
)
This produces two tasks: motor_left on pin 4 and motor_right on pin 5. One file
defines the motor pattern; the main config just says “give me two of them with these
settings.”
A complete example
Here’s a more realistic configuration that combines local tasks, included subsystems, monitoring, and logging:
(
tasks: [
(
id: "planner",
type: "tasks::PathPlanner",
),
],
cnx: [
(
src: "sensor_front",
dst: "planner",
msg: "crate::messages::SensorData",
),
(
src: "sensor_rear",
dst: "planner",
msg: "crate::messages::SensorData",
),
(
src: "planner",
dst: "motor_left",
msg: "crate::messages::MotorCommand",
),
(
src: "planner",
dst: "motor_right",
msg: "crate::messages::MotorCommand",
),
],
monitor: ( type: "cu_consolemon::CuConsoleMon" ),
logging: (
slab_size_mib: 1024,
section_size_mib: 100,
),
includes: [
(
path: "sensor.ron",
params: { "id": "front", "pin": 2 },
),
(
path: "sensor.ron",
params: { "id": "rear", "pin": 3 },
),
(
path: "motors.ron",
params: { "id": "left", "pin": 4, "direction": "forward" },
),
(
path: "motors.ron",
params: { "id": "right", "pin": 5, "direction": "reverse" },
),
],
)
The main config file focuses on architecture – how subsystems connect to each other.
The included files focus on component definition – what a sensor or motor looks like.
The connections in the main file reference tasks by their expanded IDs (sensor_front,
motor_left), which are predictable from the template + parameters.
Recursive includes
Included files can themselves include other files. This lets you build hierarchical configurations:
copperconfig.ron
├── includes left_arm.ron
│ ├── includes shoulder_motor.ron
│ └── includes elbow_motor.ron
└── includes right_arm.ron
├── includes shoulder_motor.ron
└── includes elbow_motor.ron
Each level can pass different parameters down, so shoulder_motor.ron is written once but
instantiated four times (left shoulder, left elbow, right shoulder, right elbow) – each
with its own pin assignments and IDs.
Where to put included files
There’s no strict rule, but a common convention in workspace projects is to keep included
RON files next to the main copperconfig.ron:
apps/cu_example_app/
├── copperconfig.ron # Main config (includes the others)
├── sensor.ron # Sensor subsystem template
├── motors.ron # Motor subsystem template
└── src/
└── ...
For very large projects, you might create a config/ subdirectory and use relative paths
in the includes:
includes: [
( path: "config/sensor.ron", params: { ... } ),
]
Instance-specific overrides for swarms
When several robots share the same subsystem code but need different calibration data, keep the base subsystem graph static and use a multi-Copper umbrella file with a conventional instance override tree:
(
subsystems: [
(id: "robot", config: "robot_base.ron"),
],
interconnects: [],
instance_overrides_root: "instances",
)
Copper will then probe:
instances/<instance_id>/<subsystem_id>.ron
So instance 17 for subsystem robot resolves:
instances/17/robot.ron
That file applies only config overlays, not topology changes:
(
set: [
(
path: "tasks/imu/config",
value: {
"gyro_bias": [0.012, -0.004, 0.008],
},
),
],
)
Supported paths are intentionally small:
tasks/<id>/configresources/<id>/configbridges/<id>/config
This keeps the graph static while letting each robot carry its own calibration or hardware
parameters in git. See examples/cu_instance_overrides_demo/ for a minimal example.
Difference with ROS
In ROS 2, configuration reuse is handled through launch file composition and YAML parameter files. You can include other launch files and remap parameters:
# ROS 2: composing launch files
IncludeLaunchDescription(
PythonLaunchDescriptionSource('motor_launch.py'),
launch_arguments={'motor_id': 'left', 'pin': '4'}.items(),
)
Copper’s approach is similar in spirit but different in execution:
| ROS 2 | Copper | |
|---|---|---|
| Format | Python launch files + YAML | RON files with {{param}} substitution |
| Reuse | IncludeLaunchDescription | includes array in RON |
| Parameters | Launch arguments + YAML files | params map with text substitution |
| Validation | Runtime | Compile time |
| Nesting | Launch files can include other launch files | RON files can include other RON files |
The main advantage of Copper’s approach is simplicity: it’s just text substitution in a
declarative format. No Python logic, no conditionals, no if/else chains. The included
file is a template, the parameters fill in the blanks, and the result is a flat list of
tasks and connections that Copper validates at compile time.
Further reading
- Modular Configuration in the official Copper documentation.
- Configuration reference for the full RON schema.
examples/modular_config_example/in the copper-rs repository for a working example.
Reusing Community Components
One of the biggest advantages of building your robot with Copper is that you don’t have to write everything from scratch. The copper-rs repository ships with a growing collection of ready-made components – sensor drivers, algorithms, bridges, and shared message types – that you can drop into your project.
In this chapter, we’ll explore what’s available and how to use it.
The components directory
The copper-rs repository organizes its components by role:
components/
├── sources/ Sensor drivers that produce data
├── sinks/ Actuator drivers that consume data
├── tasks/ Processing algorithms (input → output)
├── bridges/ Interfaces to external systems (Zenoh, ROS 2)
├── monitors/ Monitoring and visualization tools
├── payloads/ Shared message types
├── libs/ Supporting libraries
├── res/ Platform-specific resource bundles (HAL)
└── testing/ Test helpers (network injection, mocks)
Each component is a standalone Rust crate that implements one or more Copper tasks. You
add it as a dependency, reference it in copperconfig.ron, and you’re done – no glue
code needed.
The ecosystem is actively growing. Browse the components directory in the copper-rs repository to see what’s currently available – you’ll find LiDAR drivers, IMU drivers, camera capture, PID controllers, AprilTag detection, Zenoh and ROS 2 bridges, and more.
How to use a component
Let’s say you want to add a PID controller to your project. The process is:
1. Add the dependency
In your application’s Cargo.toml:
[dependencies]
cu-pid = { path = "../../components/tasks/cu_pid" }
cu-sensor-payloads = { path = "../../components/payloads/cu_sensor_payloads" }
Or if the component is published on crates.io, use the same Copper release for both crates that the rest of your project already uses.
In a workspace, you’d add it to the workspace-level Cargo.toml first:
[workspace.dependencies]
cu-pid = { path = "../../components/tasks/cu_pid" }
cu-sensor-payloads = { path = "../../components/payloads/cu_sensor_payloads" }
Then reference it in the app’s Cargo.toml:
[dependencies]
cu-pid = { workspace = true }
cu-sensor-payloads = { workspace = true }
2. Reference it in copperconfig.ron
Some reusable Copper tasks are generic. cu-pid is one of them, so the usual pattern is
to define a small local alias in your app code first:
#![allow(unused)]
fn main() {
use cu_pid::GenericPIDTask;
pub type PidTask = GenericPIDTask<cu_sensor_payloads::ImuPayload>;
}Then add the task to your configuration using that alias:
(
id: "pid",
type: "tasks::PidTask",
config: {
"kp": 1.0,
"ki": 0.1,
"kd": 0.05,
},
),
The config section passes parameters that the task reads in its new() constructor. If
a component exposes a concrete, non-generic task type, you can reference the crate path
directly; for generic tasks like cu-pid, a local alias keeps the RON type path simple.
3. Wire it up
Connect it to your existing tasks:
cnx: [
(
src: "imu",
dst: "pid",
msg: "cu_sensor_payloads::ImuPayload",
),
(
src: "pid",
dst: "motor",
msg: "cu_pid::PIDControlOutputPayload",
),
],
That’s it. Beyond the small alias for generic components, there is no adapter layer. The component is a Copper task like any other – it just happens to live in a separate crate.
Using shared payload types
When two components need to exchange data, they must agree on a message type. This is where the payloads crates come in.
For example, cu-sensor-payloads defines common sensor types that multiple source drivers
produce. If you use the BMI088 IMU driver (cu-bmi088), it outputs a type from
cu-sensor-payloads. Any downstream task that accepts that same type can consume the data
without any conversion.
This is the component ecosystem’s contract: drivers produce standard payload types, and
algorithms consume them. Swap a Bosch IMU for an InvenSense IMU, and the downstream
pipeline doesn’t change – both produce the same ImuPayload type.
Writing your own reusable components
If you’ve built a task that could be useful to others – or even just to your future self across projects – you can extract it into a component crate:
- Create a library crate under
components/(pick the right category). - Move your task struct and its
implintolib.rs. - Move shared message types into the crate or use existing ones from
cu-sensor-payloads. - Add it to the workspace
memberslist in the rootCargo.toml. - Reference it from your application’s
Cargo.tomlandcopperconfig.ron.
The workspace template already has placeholder directories with .keep files for each
component category. Just replace the placeholder with your crate.
Difference with ROS
In ROS 2, reusing components means installing packages (via apt or building from source)
and then referencing their nodes in your launch files. The discovery is runtime-based –
nodes find each other through DDS topics.
In Copper, reusing components means adding a Rust dependency and referencing the task
type in copperconfig.ron. The wiring is resolved at compile time.
| ROS 2 | Copper | |
|---|---|---|
| Discovery | Packages via apt / source build | Crates via Cargo.toml |
| Integration | Launch files + topic remapping | copperconfig.ron + type paths |
| Message compatibility | .msg files + code generation | Shared Rust types (payloads crates) |
| Validation | Runtime (topics may not match) | Compile time (types must match) |
| Sharing | ROS package index | crates.io / git dependencies |
The biggest difference is the compile-time guarantee. In ROS, you can wire two nodes
together with mismatched message types and only find out when you run the system. In
Copper, if your PID controller expects ImuPayload and your driver produces
CameraFrame, the compiler tells you immediately.
Automating Tasks with Just
Throughout this book, we’ve been typing long cargo commands to run the logreader, extract
CopperLists, and more. Those commands are precise but tedious – especially when they
involve feature flags, binary names, and multiple path arguments.
The workspace template ships with a justfile that wraps common operations into short,
memorable commands. In this chapter, we’ll see what just is, what recipes come built-in,
and how to visualize the task graph.
What is Just?
Just is a command runner – think of it as a modern, simpler
alternative to make for project automation. You define recipes (named commands) in a
justfile, then run them with just <recipe>.
Installing Just
If you don’t have it already:
cargo install just
Or on most Linux distributions:
curl --proto '=https' --tlsv1.2 -sSf https://just.systems/install.sh | \
bash -s -- --to ~/bin
Verify with:
just --version
The workspace justfile
Here’s the justfile that comes with the cu_full workspace template:
# Render the execution DAG from the app config.
dag:
#!/usr/bin/env bash
set -euo pipefail
APP_DIR="${APP_DIR:-cu_example_app}"
cu29-rendercfg apps/"${APP_DIR}"/copperconfig.ron --open
# Compatibility alias for older docs.
rcfg: dag
# Extract the structured log via the log reader.
log:
#!/usr/bin/env bash
set -euo pipefail
APP_DIR="${APP_DIR:-cu_example_app}"
APP_NAME="${APP_NAME:-${APP_DIR}}"
RUST_BACKTRACE=1 cargo run -p "${APP_NAME}" --features=logreader \
--bin "${APP_NAME}-logreader" \
apps/"${APP_DIR}"/logs/"${APP_NAME}".copper \
extract-text-log target/debug/cu29_log_index
# Extract CopperLists from the log output.
cl:
#!/usr/bin/env bash
set -euo pipefail
APP_DIR="${APP_DIR:-cu_example_app}"
APP_NAME="${APP_NAME:-${APP_DIR}}"
RUST_BACKTRACE=1 cargo run -p "${APP_NAME}" --features=logreader \
--bin "${APP_NAME}-logreader" \
apps/"${APP_DIR}"/logs/"${APP_NAME}".copper extract-copperlists
Three recipes, each wrapping a command we’d otherwise have to type (or remember) by hand.
The recipes
just log – Extract text logs
Remember in Logging and Replaying Data when we ran this?
cargo run --features logreader --bin my-project-logreader -- \
    logs/my-project.copper extract-text-log target/debug/cu29_log_index
In the workspace, that becomes:
just log
It extracts the structured text logs (debug!(), info!(), etc.) from the .copper file
and reconstructs the human-readable output using the compile-time string index.
just cl – Extract CopperLists
Also from Logging and Replaying Data, extracting CopperList data (the message payloads from every cycle) was:
cargo run --features logreader --bin my-project-logreader -- \
    logs/my-project.copper extract-copperlists
Now it’s just:
just cl
just dag – Render the task graph
This is the new one. Copper includes a tool called cu29-rendercfg that reads your
copperconfig.ron and generates a visual diagram of the task graph – an SVG showing
all tasks and their connections as a directed acyclic graph (DAG).
Let’s try it on our workspace.
Then, from the my_workspace/ directory:
just dag
This renders the DAG from apps/cu_example_app/copperconfig.ron and opens it in your
default browser. You’ll see a diagram like:
┌─────────┐ ┌─────────┐ ┌─────────┐
│ src │────▶│ t-0 │────▶│ sink │
└─────────┘ └─────────┘ └─────────┘
For our simple three-task pipeline, the diagram is straightforward. But as your robot grows to 10, 20, or 50 tasks with complex wiring, this visualization becomes invaluable for understanding the data flow at a glance.
Targeting a different app
All three recipes default to cu_example_app. If your workspace has multiple applications,
override the target with environment variables:
APP_DIR=my_other_app just log
APP_DIR=my_other_app just cl
APP_DIR=my_other_app just dag
The APP_DIR variable controls which app directory to look in, and APP_NAME (which
defaults to APP_DIR) controls the binary and package name passed to cargo.
just rcfg still works as a compatibility alias, but just dag is the current primary
name in the generated template.
Adding your own recipes
The justfile is yours to extend. Here are some recipes you might add as your project
evolves:
# Run the main application.
run:
cargo run -p cu_example_app
# Run with the console monitor enabled.
run-mon:
cargo run -p cu_example_app -- --monitor
# Build everything in release mode.
release:
cargo build --release
# Clean build artifacts and log files.
clean:
cargo clean
rm -f apps/*/logs/*.copper
Recipes are just shell commands with names. If you find yourself typing the same command twice, make it a recipe.
Why not make?
You could use make for all of this, and some people do. just has a few advantages for
this use case:
- No tabs-vs-spaces headaches –
justuses consistent indentation rules. - No implicit rules – every recipe is explicit. No “magic”
.PHONYtargets. - Variables and defaults –
justsupports environment variable defaults natively (the${APP_DIR:-cu_example_app}syntax). - Cross-platform – works the same on Linux, macOS, and Windows.
- No build system baggage –
justis purely a command runner, not a build system. Cargo is already your build system.
Advanced Task Features
In the earlier chapters we treated #[derive(Reflect)], impl Freezable, and
type Resources<'r> = () as required boilerplate. This chapter explains what each of
these does and when you’d want to customize them.
#[derive(Reflect)]
The Reflect derive macro enables runtime introspection on your task struct.
Monitoring tools and simulation environments use it to inspect a task’s fields at runtime
without knowing the concrete type at compile time.
#![allow(unused)]
fn main() {
#[derive(Reflect)]
pub struct MyController {
kp: f64,
ki: f64,
accumulated_error: f64,
}
}With Reflect derived, a monitoring UI could display kp, ki, and
accumulated_error as live values while the robot is running.
In practice: always add #[derive(Reflect)] to your task structs. It enables
monitoring and simulation tooling when you need it.
Freezable – State Serialization
The Freezable trait enables Copper’s deterministic replay system. The runtime
periodically takes “snapshots” (keyframes) of every task’s internal state, much like
keyframes in a video codec. During replay, it can jump to any snapshot instead of
replaying from the very beginning.
Stateless tasks
For tasks that hold no internal state (or state that can be trivially reconstructed), the empty implementation is all you need:
#![allow(unused)]
fn main() {
impl Freezable for MySource {}
}This tells Copper “there’s nothing to snapshot for this task.” This is what we’ve been using throughout the book, and it’s correct for all our tasks so far – they don’t carry any state between cycles.
Stateful tasks
If your task maintains state that affects its behavior across cycles – for example, a PID
controller accumulating error, a Kalman filter maintaining a covariance matrix, or a
counter tracking message sequence numbers – you should implement the freeze and thaw
methods.
The Freezable trait uses bincode’s Encoder and Decoder for serialization:
#![allow(unused)]
fn main() {
use cu29::prelude::*;
use bincode::enc::Encoder;
use bincode::de::Decoder;
use bincode::error::{EncodeError, DecodeError};
#[derive(Reflect)]
pub struct PidController {
kp: f64,
ki: f64,
kd: f64,
accumulated_error: f64,
previous_error: f64,
}
impl Freezable for PidController {
fn freeze<E: Encoder>(&self, encoder: &mut E) -> Result<(), EncodeError> {
// Serialize the fields that change at runtime
bincode::Encode::encode(&self.accumulated_error, encoder)?;
bincode::Encode::encode(&self.previous_error, encoder)?;
Ok(())
}
fn thaw<D: Decoder>(&mut self, decoder: &mut D) -> Result<(), DecodeError> {
self.accumulated_error = bincode::Decode::decode(decoder)?;
self.previous_error = bincode::Decode::decode(decoder)?;
Ok(())
}
}
}freeze serializes the task’s mutable state using bincode’s Encode trait.
thaw deserializes it back using Decode. The runtime calls these automatically at
keyframe boundaries.
Rule of thumb: Only serialize fields that change during
process(). Configuration fields likekp,ki,kdare set once innew()and don’t need to be frozen – they’ll be reconstructed fromcopperconfig.ronduring replay.
When does this matter?
If you never use Copper’s replay features, the empty impl Freezable is fine for every
task. But if you plan to record and replay robot runs (one of Copper’s strongest features),
implementing Freezable correctly means the replay system can seek to any point in the
log efficiently rather than replaying from the start.
Think of it like a video file: without keyframes, you’d have to decode from the beginning
every time you want to seek. With keyframes (state snapshots), you can jump to any point
and resume from there. Freezable is how Copper creates those keyframes for your task’s
internal state.
Resources – Hardware Injection
The type Resources<'r> associated type declares what hardware or system resources a
task needs. Resources represent physical endpoints – serial ports, GPIO controllers, SPI
buses, cameras – or shared services like a thread pool.
No resources
Most tasks in a simple project don’t need external resources:
#![allow(unused)]
fn main() {
type Resources<'r> = ();
}This means “give me nothing.” The _resources parameter in new() is just (). This is
what we’ve used throughout the book.
The problem resources solve
On a real robot, a sensor driver needs access to a hardware peripheral – say, a serial port or an SPI bus. Where does that handle come from? You have a few options:
-
Create it inside
new()– Works, but what if two tasks need the same bus? Or if the hardware needs platform-specific initialization that your task shouldn’t know about? -
Pass it as a global – Not great for testing, portability, or safety.
-
Have the runtime inject it – This is what Resources does. You declare what you need, and the runtime provides it.
How it works
Resources involve three pieces:
1. A resource provider (called a “bundle”) is declared in copperconfig.ron:
resources: [
(
id: "board",
provider: "crate::resources::BoardBundle",
config: { "uart_device": "/dev/ttyUSB0" },
),
],
The bundle is a Rust type that knows how to create the actual hardware handles (open the serial port, initialize GPIO, etc.).
2. Tasks declare which resources they need in copperconfig.ron:
(
id: "imu",
type: "tasks::ImuDriver",
resources: { "serial": "board.uart0" },
),
This says: “the imu task needs a resource it calls serial, and it should be bound to
the uart0 resource from the board bundle.”
3. The task declares a Resources type in its Rust implementation that knows how to
pull the bound resources from the runtime’s resource manager:
#![allow(unused)]
fn main() {
impl CuSrcTask for ImuDriver {
type Resources<'r> = ImuResources<'r>;
type Output<'m> = output_msg!(ImuPayload);
fn new(
config: Option<&ComponentConfig>,
resources: Self::Resources<'_>,
) -> CuResult<Self> {
// resources.serial is the hardware handle, injected by the runtime
Ok(Self { port: resources.serial })
}
// ...
}
}Why this design?
Resources keep your tasks portable. An IMU driver doesn’t need to know which serial
port to open – that’s a deployment detail. On one robot it might be /dev/ttyUSB0, on
another it might be a different bus entirely. By moving the hardware binding to the
configuration, the same task code works on different platforms without changes.
Resources can also be shared. A shared bus (like I2C) can be bound to multiple tasks.
The resource manager handles the ownership semantics: exclusive resources are moved to a
single task, shared resources are behind an Arc and can be borrowed by many.
When do you need resources?
For the projects in this book, type Resources<'r> = () is all you need. Resources become
important when you:
- Write drivers that talk to real hardware (serial, SPI, GPIO, USB)
- Need multiple tasks to share a hardware bus
- Want the same task to work across different boards without code changes
- Want to swap real hardware for mocks in testing
The examples/cu_resources_test/ in the copper-rs repository is a complete working example
that demonstrates bundles, shared resources, owned resources, and mission-specific resource
bindings.
Summary
| Feature | Purpose | When to customize |
|---|---|---|
#[derive(Reflect)] | Runtime introspection for monitoring/simulation | Always use the derive; the feature flag controls cost |
impl Freezable | State snapshots for deterministic replay | Implement freeze/thaw for stateful tasks |
type Resources<'r> | Hardware/service dependency injection | Declare resource types when your task needs hardware handles |
For most of the projects you’ll build while learning Copper, the defaults are fine:
#[derive(Reflect)] on the struct, empty impl Freezable, and type Resources<'r> = ().
These become important as you move from prototyping to deploying on real hardware with
real replay requirements.
Writing a Bridge
So far, our Copper apps have been made from sources, tasks, and sinks. Those are enough when every endpoint is independent. A bridge is for the next case: one external connection or protocol has several logical channels that should share the same state.
This chapter builds a tiny bridge with one incoming channel and one outgoing channel. It does not talk to real hardware. That is intentional: the goal is to learn the bridge shape without also learning serial ports, sockets, ROS 2, CAN, or motor protocols.
The bridge will keep two pieces of state:
#![allow(unused)]
fn main() {
connected: bool,
messages_seen: u64,
}connected changes in the bridge lifecycle. messages_seen increments when the bridge
receives a command. When the bridge sends a status message, it can see the same
messages_seen value. That small bit of shared state is the reason this belongs in one
bridge instead of two unrelated tasks.
The graph will look like this:
counter/command_in ──▶ CountCommands ──▶ counter/status_out
Rx channel task Tx channel
Step 1: Add message types
Create a new file called src/messages.rs:
#![allow(unused)]
fn main() {
use bincode::{Decode, Encode};
use cu29::prelude::*;
use serde::{Deserialize, Serialize};
#[derive(Default, Debug, Clone, Serialize, Deserialize, Encode, Decode, Reflect)]
pub struct CommandPayload {
pub requested_count: u64,
}
#[derive(Default, Debug, Clone, Serialize, Deserialize, Encode, Decode, Reflect)]
pub struct StatusPayload {
pub cycles: u64,
}
}These are normal Copper payloads. The bridge receives CommandPayload from the outside
world and sends StatusPayload back out.
Checkpoint: after this step, src/messages.rs should contain only payload types. It
should not mention bridges or tasks yet.
Step 2: Add a task between the bridge channels
Edit src/tasks.rs and add this task:
#![allow(unused)]
fn main() {
use crate::messages::{CommandPayload, StatusPayload};
use cu29::prelude::*;
#[derive(Default, Reflect)]
pub struct CountCommands {
cycles: u64,
}
impl Freezable for CountCommands {}
impl CuTask for CountCommands {
type Resources<'r> = ();
type Input<'m> = input_msg!(CommandPayload);
type Output<'m> = output_msg!(StatusPayload);
fn new(
_config: Option<&ComponentConfig>,
_resources: Self::Resources<'_>,
) -> CuResult<Self> {
Ok(Self { cycles: 0 })
}
fn process<'i, 'o>(
&mut self,
_ctx: &CuContext,
input: &Self::Input<'i>,
output: &mut Self::Output<'o>,
) -> CuResult<()> {
if input.payload().is_some() {
self.cycles += 1;
output.set_payload(StatusPayload {
cycles: self.cycles,
});
} else {
output.clear_payload();
}
Ok(())
}
}
}This task is deliberately small. It counts how many command messages reached it and emits that count as status.
If your tasks.rs already has use cu29::prelude::*;, do not add it twice. Add only the
use crate::messages::{CommandPayload, StatusPayload}; line and the CountCommands
struct/implementation.
Checkpoint: the task should compile as an ordinary CuTask: one input payload, one
output payload, no resources.
Step 3: Declare bridge channels
Create a new file called src/bridges.rs:
#![allow(unused)]
fn main() {
use crate::messages::{CommandPayload, StatusPayload};
use cu29::prelude::*;
rx_channels! {
pub struct CounterRxChannels : CounterRxId {
command_in => CommandPayload = "counter/command_in",
}
}
tx_channels! {
pub struct CounterTxChannels : CounterTxId {
status_out => StatusPayload = "counter/status_out",
}
}
}The rx_channels! macro declares channels that enter Copper from the outside world. The
tx_channels! macro declares channels that leave Copper for the outside world.
Each channel has three pieces:
| Piece | Example | Meaning |
|---|---|---|
| Channel id | command_in | Name used by the mission config |
| Payload type | CommandPayload | Message type on that channel |
| Default route | "counter/command_in" | External route/topic/path if the config does not override it |
Checkpoint: after this step, the bridge has channel declarations but no bridge struct yet. That is normal.
Step 4: Implement the bridge state
In the same src/bridges.rs file, add the bridge struct:
#![allow(unused)]
fn main() {
#[derive(Default, Reflect)]
pub struct CounterBridge {
connected: bool,
messages_seen: u64,
}
impl Freezable for CounterBridge {}
}This is the shared state owned by the bridge instance.
For this tutorial, messages_seen is used only for debug output, so the empty
Freezable implementation is fine. If bridge state affects real outputs during replay,
implement freeze and thaw as shown in the previous chapter.
Checkpoint: the state should belong to the bridge, not to a global variable. Bridge
methods will receive &mut self, so they can update this state safely.
Step 5: Implement CuBridge::new
Continue in src/bridges.rs:
#![allow(unused)]
fn main() {
impl CuBridge for CounterBridge {
type Resources<'r> = ();
type Tx = CounterTxChannels;
type Rx = CounterRxChannels;
fn new(
_config: Option<&ComponentConfig>,
_tx_channels: &[BridgeChannelConfig<<Self::Tx as BridgeChannelSet>::Id>],
_rx_channels: &[BridgeChannelConfig<<Self::Rx as BridgeChannelSet>::Id>],
_resources: Self::Resources<'_>,
) -> CuResult<Self>
where
Self: Sized,
{
Ok(Self {
connected: false,
messages_seen: 0,
})
}
}Unlike a task constructor, a bridge constructor receives the configured Tx and Rx channel lists. Real bridges use those lists to read routes, topic names, baud rates, QoS settings, or other per-channel configuration. This first bridge ignores them.
Checkpoint: this code opens the impl CuBridge for CounterBridge block but does not
close it yet. The next steps add lifecycle, receive, and send methods inside the same
block.
Step 6: Add lifecycle methods
Still inside the impl CuBridge for CounterBridge block, add:
#![allow(unused)]
fn main() {
fn start(&mut self, _ctx: &CuContext) -> CuResult<()> {
self.connected = true;
debug!("CounterBridge connected");
Ok(())
}
fn stop(&mut self, _ctx: &CuContext) -> CuResult<()> {
self.connected = false;
debug!("CounterBridge disconnected after {} messages", self.messages_seen);
Ok(())
}
}start runs before bridge I/O begins. stop runs when the application shuts down. A real
bridge might open and close a serial port here. Our tutorial bridge only flips a boolean.
Checkpoint: after this step, connected is changed only by lifecycle methods. That
makes it easy to reason about.
Step 7: Receive commands
Add the receive method inside the same impl block:
#![allow(unused)]
fn main() {
fn receive<'a, Payload>(
&mut self,
_ctx: &CuContext,
channel: &'static BridgeChannel<CounterRxId, Payload>,
msg: &mut CuMsg<Payload>,
) -> CuResult<()>
where
Payload: CuMsgPayload + 'a,
{
match channel.id() {
CounterRxId::CommandIn => {
self.messages_seen += 1;
msg.set_payload(Payload::default());
debug!("CounterBridge received command {}", self.messages_seen);
}
}
Ok(())
}
}The method is generic over Payload because a real bridge can have many Rx channels with
different payload types. This example has only one Rx channel, so the match has one arm.
The important part is the state change:
#![allow(unused)]
fn main() {
self.messages_seen += 1;
}That state will still be available when the bridge sends status later in the same graph.
Checkpoint: receive should write into the provided msg buffer with
msg.set_payload(...). Do not allocate a new message.
Step 8: Send status
Finish the impl CuBridge block with send and the final closing brace:
#![allow(unused)]
fn main() {
fn send<'a, Payload>(
&mut self,
_ctx: &CuContext,
channel: &'static BridgeChannel<CounterTxId, Payload>,
msg: &CuMsg<Payload>,
) -> CuResult<()>
where
Payload: CuMsgPayload + 'a,
{
match channel.id() {
CounterTxId::StatusOut => {
if self.connected {
debug!(
"CounterBridge sent status; bridge has seen {} commands",
self.messages_seen
);
} else {
warn!("CounterBridge tried to send while disconnected");
}
debug!("Status payload present: {}", msg.payload().is_some());
}
}
Ok(())
}
}
}This is where the example shows shared bridge state. receive increments
messages_seen; send reads it. Both methods are part of the same bridge instance.
Checkpoint: the send method should consume the msg passed by the runtime. It
should not call the CountCommands task directly. The graph decides what data reaches the
Tx channel.
Step 9: Register the new modules
Edit src/main.rs. Near the existing module declarations, add:
#![allow(unused)]
fn main() {
pub mod bridges;
pub mod messages;
}If your file already has:
#![allow(unused)]
fn main() {
pub mod tasks;
}then the top of the file should now look like:
#![allow(unused)]
fn main() {
pub mod bridges;
pub mod messages;
pub mod tasks;
}Checkpoint: copperconfig.ron will reference bridges::CounterBridge,
tasks::CountCommands, and messages::..., so all three modules must be visible from
the crate root.
Step 10: Wire the bridge in copperconfig.ron
Replace the simple three-task pipeline with this bridge graph:
(
tasks: [
(
id: "count_commands",
type: "tasks::CountCommands",
),
],
bridges: [
(
id: "counter",
type: "bridges::CounterBridge",
channels: [
Rx(
id: "command_in",
route: "counter/command_in",
),
Tx(
id: "status_out",
route: "counter/status_out",
),
],
),
],
cnx: [
(
src: "counter/command_in",
dst: "count_commands",
msg: "messages::CommandPayload",
),
(
src: "count_commands",
dst: "counter/status_out",
msg: "messages::StatusPayload",
),
],
)
The important syntax is the endpoint path:
bridge_id/channel_id
counter/command_in is an Rx channel, so it can only be a source endpoint.counter/status_out is a Tx channel, so it can only be a destination endpoint.
Checkpoint: the direction should read naturally:
external command -> bridge Rx -> task -> bridge Tx -> external status
If you accidentally wire a Tx channel as a source, or an Rx channel as a destination, Copper should reject the configuration.
Step 11: Build and run
Run a compile check first:
cargo check
If that passes, run the app:
cargo run
You should see debug logs showing that the bridge connected, received commands, and sent status messages. The exact output depends on your logger and monitor setup, but the important pattern is:
CounterBridge connected
CounterBridge received command 1
CounterBridge sent status; bridge has seen 1 commands
Checkpoint: if you see both receive and send logs, the bridge is wired correctly. If
you see receive logs but no send logs, check the count_commands -> counter/status_out
connection. If you see no bridge logs, check that pub mod bridges; exists in main.rs
and that copperconfig.ron has a bridges section.
What this example leaves out
This bridge is intentionally fake. It does not open a socket, parse bytes, or talk to a device. Those details are transport-specific, and adding them now would hide the important shape:
- Declare Rx and Tx channels.
- Store shared state in the bridge struct.
- Use
startandstopfor connection lifecycle. - Use
receiveto fill Copper messages from outside data. - Use
sendto consume Copper messages and write them outside. - Wire bridge channels with
bridge_id/channel_idincopperconfig.ron.
Once that shape is clear, real bridges are mostly a matter of replacing the fake receive and send bodies with protocol code.
Examples to read next
After you finish this chapter, the cleanest examples to read are:
| Example | Why read it |
|---|---|
examples/cu_bridge_test | Shows bridge scheduling and graph wiring with small in-repo bridge implementations. Start here if you want to see Rx-to-task, task-to-Tx, loopback, and fanout shapes. |
examples/cu_resources_test/src/bridges.rs | Shows a compact custom bridge that receives injected resources. Read this after the resources chapter. |
examples/cu_zenoh_bridge_demo | Shows a real middleware bridge used by two Copper apps. This is a good next step once the simple bridge API is familiar. |
There are also protocol-specific bridges such as MSP, CRSF, DSHOT, ROS 2, and Iceoryx2. Those are useful references, but they are not the first examples to read: each one adds domain-specific protocol details on top of the bridge mechanics.
When to make a bridge
Use a bridge when the channels belong to the same external connection or protocol:
- One serial port with commands in and telemetry out
- One CAN bus with several message IDs
- One middleware session with several topics
- One ESC bus with command and telemetry channels
Use plain sources and sinks when the endpoints are independent and do not need shared transport state.
Summary
A bridge is not just a source and a sink placed next to each other. It is one component
that owns shared protocol state and exposes several typed channels to Copper. In this
chapter, CounterBridge owned connected and messages_seen; its Rx and Tx methods both
used that state through one bridge instance.
The small counter example is not useful as a robot driver, but it is useful as a template:
start with channel declarations, add the bridge state, implement CuBridge, and then wire
the channels into the graph.
Interfacing a Simulator
The usual simulator integration is an event callback loop:
simulator tick
-> fill Copper's simulated inputs for this tick
-> let Copper run the tasks that should run
-> read Copper's outputs
-> apply those outputs to the simulator
-> advance the simulator
That is the mental model to start with. Copper does not currently ship a ready-made integration for every simulator. The Bevy examples are the concrete examples in this repository, and users have also integrated Copper successfully with simulators such as Isaac Sim, CARLA, and MuJoCo. In all of those cases, the job is to write a thin adapter at the simulator boundary.
If the simulator runs in another process, that adapter can use whatever RPC or message transport fits your setup: sockets, shared memory, middleware topics, or the simulator’s own API. The important part is still the same: each simulator step produces observations for Copper, Copper runs the graph, and commands are sent back to the simulator at a known point in the simulation step.
The callback shape
In simulation mode, Copper generates a SimStep enum from your copperconfig.ron. Each
variant corresponds to one task step in the graph.
Your simulator callback receives those steps while Copper is running an iteration. For each step it returns one of two common answers:
| Return value | Meaning |
|---|---|
SimOverride::ExecuteByRuntime | Copper should run that task normally. Use this for estimation, control, planning, and other algorithm tasks. |
SimOverride::ExecutedBySim | The simulator handled that step. Use this for simulated sensors and actuators. |
The common pattern is:
- Build the Copper runtime in
sim_mode = true. - Register a simulation callback.
- On each simulator tick, update Copper’s clock to the simulator time.
- When Copper reaches a simulated hardware task, fill its output from simulator state.
- When Copper reaches a simulated actuator task, read the command and store it for the simulator.
- Let all ordinary algorithm tasks run normally.
For example, a balancing robot simulator might do this:
Bevy physics tick
-> set Copper time to the current physics time
-> encoder task output is filled from wheel position in the sim
-> angle sensor task output is filled from body orientation in the sim
-> controller tasks run normally
-> motor task output is captured
-> motor force is applied to the simulated body
The controller does not know this is a simulation. It sees the same kind of messages it would see on the real robot.
What to implement first
For any simulator that can call into Copper directly, start with a small adapter layer owned by the simulator:
#![allow(unused)]
fn main() {
struct MySimCopperAdapter {
copper: MyRobotSim,
clock: RobotClock,
clock_mock: RobotClockMock,
last_motor_command: MotorCommand,
}
}Then wire it into your simulator’s tick/update function:
#![allow(unused)]
fn main() {
fn simulator_tick(adapter: &mut MySimCopperAdapter, sim: &mut MySimulator) -> CuResult<()> {
adapter.clock_mock.set_value(sim.time_nanos());
let mut callback = |step| {
match step {
my_robot::SimStep::Imu(CuTaskCallbackState::Process(_, output)) => {
output.set_payload(sim.read_imu());
SimOverride::ExecutedBySim
}
my_robot::SimStep::Motor(CuTaskCallbackState::Process(input, _output)) => {
if let Some(command) = input.payload() {
adapter.last_motor_command = *command;
}
SimOverride::ExecutedBySim
}
_ => SimOverride::ExecuteByRuntime,
}
};
adapter.copper.run_one_iteration(&mut callback)?;
sim.apply_motor_command(adapter.last_motor_command);
sim.step();
Ok(())
}
}Treat this as pseudocode: the generated runtime type and step names come from your
copperconfig.ron, and your payload types will be your own. The important point is where
the simulator code lives. It lives in the simulation adapter, not inside the controller
tasks.
In practice, simulated sensors write to output, simulated actuators read from input,
and the estimation/control/planning tasks return ExecuteByRuntime.
Types to look for
When adapting a simulator, these are the Copper pieces to grep for in existing examples:
| Item | Why it matters |
|---|---|
#[copper_runtime(..., sim_mode = true)] | Generates the simulation-aware runtime and SimStep enum for your graph. |
SimStep | The generated enum you match in the simulation callback. The variants come from task ids in copperconfig.ron. |
CuTaskCallbackState::Process(input, output) | Gives the callback access to a task’s input and output messages for that step. |
SimOverride::ExecutedBySim | Return this when the simulator filled the output or consumed the actuator command. |
SimOverride::ExecuteByRuntime | Return this when Copper should run the task normally. |
RobotClock::mock() and RobotClockMock::set_value(...) | Let the simulator drive Copper time from simulation time. |
run_one_iteration(&mut callback) | Runs one Copper iteration while giving your callback a chance to handle simulated steps. |
The most useful files to read are:
# From a checkout of the main Copper repository:
rg "sim_mode|SimStep|SimOverride|CuTaskCallbackState|run_one_iteration|RobotClock::mock" extra-examples/examples/cu_rp_balancebot/src
rg "sim_mode|SimStep|SimOverride|CuTaskCallbackState|run_one_iteration|RobotClock::mock" extra-examples/examples/cu_flight_controller/src
The first line in the tick function is not incidental:
#![allow(unused)]
fn main() {
adapter.clock_mock.set_value(sim.time_nanos());
}For simulation, Copper should usually see simulation time, not wall-clock time. If the simulator pauses, Copper time pauses. If the simulator runs faster than real time, the timestamps still describe the simulated run. Decide here whether one simulator tick equals one Copper tick, whether Copper runs on every physics substep, and whether commands apply immediately or on the next simulator step.
Pick an ownership pattern
Choose the shape that matches who owns the main loop.
The simulator owns the loop
This is the most common shape for an interactive simulator.
Your simulator has the main loop. Each simulator tick calls Copper, Copper runs the graph, and the simulator applies the resulting commands.
Use this when:
- the simulator has a physics or rendering loop
- the simulator already controls pause, reset, and stepping
- you want interactive visualization
- you want one Copper tick per simulator tick, or one Copper tick every N simulator ticks
The Bevy examples in the main Copper repository’s extra-examples/ folder use this style:
| Example | What it demonstrates |
|---|---|
examples/cu_rp_balancebot | Bevy owns the physics tick. The simulation callback fills encoder/ADC-style task outputs from the world and applies motor output back into the world. |
examples/cu_flight_controller | Bevy owns the flight simulation. Copper runs the flight-control graph while simulated hardware endpoints provide IMU, barometer, magnetometer, GNSS, RC, battery, and motor behavior. |
These examples are useful even if you are not using Bevy. Look for the simulator callback layer: that is the part to copy conceptually.
In cu_rp_balancebot, the callback does exactly this:
Balposis a simulated angle sensor, so the callback writes an ADC payload from the simulated body orientation.Railposis a simulated encoder, so the callback writes encoder ticks from the simulated cart position.Motoris a simulated actuator, so the callback reads the motor command and applies a force in the physics world.- all other steps return
ExecuteByRuntime.
Copper owns the loop
Use this when the simulator is a small model or library that Copper can step directly.
In this shape, the Copper app drives the timing. Simulated sensor tasks read from the model, normal tasks run, and simulated actuator tasks write back to the model. This is a good fit for headless tests and deterministic algorithm checks.
Use this when:
- the simulator has no strict main loop of its own
- rendering is not important
- you want batch tests or faster-than-real-time runs
- the simulator can be stepped from Rust without blocking
Exporting Data to Other Formats
In the logging chapter, we learned how Copper records everything
into .copper files and how the log reader can extract text logs and CopperList data as
JSON. But JSON is just the beginning. Real-world workflows often need data in other
formats – CSV for spreadsheets and data science tools, MCAP for visualization in
Foxglove, or statistics JSON for offline performance analysis.
The log reader CLI you already have supports all of these. In this chapter, we’ll explore
every export format and diagnostic tool available in cu29-export.
A quick refresher
Recall from Logging and Replaying Data that your project ships with a log reader binary at
src/logreader.rs:
pub mod tasks;
use cu29::prelude::*;
use cu29_export::run_cli;
gen_cumsgs!("copperconfig.ron");
#[cfg(feature = "logreader")]
fn main() {
run_cli::<CuStampedDataSet>().expect("Failed to run the export CLI");
}This program uses the gen_cumsgs! macro to generate a CuStampedDataSet type that knows
how to decode your project’s specific messages. Every subcommand we’ll use in this chapter
goes through this same binary – you just pass different arguments.
Make sure you have a .copper log file from a previous run (see Logging and Replaying Data if you need to
generate one):
ls -lh logs/
-rw-r--r-- 1 user user 4.0K logs/my-project.copper
CSV export
We already saw how extract-copperlists outputs JSON by default. But if you’re working
with spreadsheets, pandas, or any data analysis tool, CSV is often more convenient.
The --export-format flag (or -e for short) switches the output format:
cargo run --features logreader --bin my-project-logreader -- \
logs/my-project.copper extract-copperlists --export-format csv
The output looks like this:
id, src_time, src_tov, src,, t_0_time, t_0_tov, t_0,, sink_time, sink_tov, sink,
0, [672.083 µs – 734.327 µs], None, {"value":42}, [735.631 µs – 750.445 µs], None, {"value":43}
1, [1.000 s – 1.000 s], None, {"value":42}, [1.000 s – 1.000 s], None, {"value":43}
2, [2.000 s – 2.000 s], None, {"value":42}, [2.000 s – 2.000 s], None, {"value":43}
...
Each row is one CopperList (one execution cycle). The columns are:
id– The CopperList sequence number.<task>_time– The process time range (start-end in nanoseconds) for that task’sprocess()call.<task>_tov– The time of validity, if the task set one.<task>– The payload as inline JSON.
The column headers are generated from your task IDs, so they’ll match whatever you named
your tasks in copperconfig.ron.
Tip: You can redirect the output to a file and open it in any spreadsheet application or load it into a pandas DataFrame:
cargo run --features logreader --bin my-project-logreader -- \
    logs/my-project.copper extract-copperlists -e csv > data.csv
import pandas as pd df = pd.read_csv("data.csv")
Checking log integrity with fsck
Before doing any analysis on a log file, it’s good practice to verify its integrity. The
fsck subcommand reads the entire log and checks that all sections are well-formed:
cargo run --features logreader --bin my-project-logreader -- \
    logs/my-project.copper fsck
The log checked out OK.
        === Statistics ===
  Total time       -> 1.999 s
  Total used size  -> 328 bytes
  Logging rate     -> 0.00 MiB/s (effective)

  # of CL          -> 2
  CL rate          -> 1.00 Hz
  CL total size    -> 129 bytes

  # of Keyframes   -> 1
  KF rate          -> 0.50 Hz
  KF total size    -> 7 bytes

  # of SL entries  -> 13
  SL total size    -> 192 bytes
Even without the verbose flag, fsck gives you a useful summary:
- Total time – How long the recording lasted.
- CL rate – How many CopperLists per second were logged (should match your
rate_target_hz). - Keyframes – Periodic snapshots of frozen task state, used for seeking during replay.
- SL entries – The number of structured log lines (
debug!(),info!(), etc.).
Verbose mode
Add -v for section-by-section details, or -vv for maximum verbosity:
cargo run --features logreader --bin my-project-logreader -- \
    logs/my-project.copper fsck -v
This prints every section header as it’s read, along with the CopperList ID ranges and time ranges within each section. It’s invaluable for debugging corrupted logs – you can see exactly where the corruption starts.
Log statistics
The log-stats subcommand computes per-edge statistics from the log and writes them as a
JSON file. This is useful for offline analysis of your task graph’s performance:
cargo run --features logreader --bin my-project-logreader -- \
    logs/my-project.copper log-stats --output stats.json --config copperconfig.ron
This produces a stats.json file with detailed statistics for every edge in your task
graph:
{
  "schema_version": 1,
  "config_signature": "fnv1a64:166f6eae65f80d15",
  "mission": null,
  "edges": [
    {
      "src": "src",
      "dst": "sink",
      "msg": "crate::tasks::MyPayload",
      "samples": 3,
      "none_samples": 0,
      "valid_time_samples": 3,
      "total_raw_bytes": 12,
      "avg_raw_bytes": 4.0,
      "rate_hz": 1.0004343150476716,
      "throughput_bytes_per_sec": 6.002605890286029
    },
    {
      "src": "src",
      "dst": "t-0",
      "msg": "crate::tasks::MyPayload",
      "samples": 3,
      "none_samples": 0,
      "valid_time_samples": 3,
      "total_raw_bytes": 12,
      "avg_raw_bytes": 4.0,
      "rate_hz": 1.0004343150476716,
      "throughput_bytes_per_sec": 6.002605890286029
    },
    {
      "src": "t-0",
      "dst": "sink",
      "msg": "crate::tasks::MyPayload",
      "samples": 3,
      "none_samples": 0,
      "valid_time_samples": 3,
      "total_raw_bytes": 12,
      "avg_raw_bytes": 4.0,
      "rate_hz": 1.0004283749265024,
      "throughput_bytes_per_sec": 6.002570249559014
    }
  ],
  "perf": {
    "samples": 3,
    "valid_time_samples": 3,
    "end_to_end": {
      "min_ns": 74413,
      "max_ns": 178994,
      "mean_ns": 114416.0,
      "stddev_ns": 46095.0
    },
    "jitter": {
      "min_ns": 15429,
      "max_ns": 104581,
      "mean_ns": 60005.0,
      "stddev_ns": 44576.0
    }
  }
}
For each edge in the graph, you get:
samples– Total number of CopperLists processed.none_samples– How many times the payload wasNone(the task produced no output for that cycle).rate_hz– The measured message rate on this edge.avg_raw_bytes– Average payload size in bytes.throughput_bytes_per_sec– Sustained data throughput on this edge.
The perf section gives you pipeline-level timing:
end_to_end– Latency from the first task’sprocess()start to the last task’sprocess()end, across the full pipeline.jitter– Variation in that end-to-end latency between consecutive cycles.
Using with missions
If your project uses missions, pass the --mission flag to select which
mission’s graph to use for the edge mapping:
cargo run --features logreader --bin my-project-logreader -- \
    logs/my-project.copper log-stats --config copperconfig.ron --mission normal
MCAP export for Foxglove
MCAP is an open-source container format designed for multimodal robotics data. It’s the native format of Foxglove, a powerful web-based visualization tool for robotics. Exporting your Copper logs to MCAP lets you visualize your pipeline’s data in Foxglove’s timeline, plot panels, and 3D views.
Enabling the MCAP feature
MCAP export requires an additional feature flag. Add mcap to your logreader’s feature
dependencies in Cargo.toml:
[features]
logreader = ["dep:cu29-export"]
logreader-mcap = ["logreader", "cu29-export/mcap"]
And make sure your existing cu29-export dependency enables the "mcap" feature.
Note: If your project already depends on
cu29-exportviagit, a localpath, or crates.io, keep that same source and Copper release and just add the"mcap"feature.
Implementing PayloadSchemas
When the mcap feature is enabled, run_cli requires your CuStampedDataSet to
implement the PayloadSchemas trait. This trait tells the MCAP exporter what JSON Schema
to use for each task’s payload, so Foxglove can understand your data structure.
The gen_cumsgs! macro does not implement this trait automatically – you need to add
the implementation yourself in src/logreader.rs. Here’s what it looks like for our
project where every task uses MyPayload:
pub mod tasks;

use cu29::prelude::*;
use cu29_export::run_cli;

gen_cumsgs!("copperconfig.ron");

#[cfg(feature = "logreader-mcap")]
use cu29_export::serde_to_jsonschema::trace_type_to_jsonschema;
#[cfg(feature = "logreader-mcap")]
impl PayloadSchemas for cumsgs::CuStampedDataSet {
    fn get_payload_schemas() -> Vec<(&'static str, String)> {
        let task_ids =
            <cumsgs::CuStampedDataSet as MatchingTasks>::get_all_task_ids();
        let schema = trace_type_to_jsonschema::<tasks::MyPayload>();
        task_ids.iter().map(|&id| (id, schema.clone())).collect()
    }
}

fn main() {
    run_cli::<CuStampedDataSet>().expect("Failed to run the export CLI");
}
The key pieces:
trace_type_to_jsonschema::<T>()– Introspects a Rust type at compile time usingserde-reflectionand produces a JSON Schema string. Your payload type must deriveSerializeandDeserialize.MatchingTasks::get_all_task_ids()– Returns the task IDs from your config, in graph order. The macro generates this for you.- The
#[cfg(feature = "logreader-mcap")]guard ensures this code only compiles when the MCAP feature is active, so your regularlogreaderfeature keeps working without the extra dependency.
If your tasks use different payload types, you’ll need to map each task ID to its specific schema instead of reusing a single one. See the cu_caterpillar example in the Copper repository for a reference.
Exporting to MCAP
Once the feature is enabled, a new export-mcap subcommand becomes available:
cargo run --features logreader-mcap --bin my-project-logreader -- \
    logs/my-project.copper export-mcap --output data.mcap
Exporting copperlists to MCAP format: data.mcap
MCAP Export: 5 CopperLists → 10 messages, 2 channels, 2 schemas
The export creates one MCAP channel per task output (named /<task-id>), and one
schema per message type. Schemas are generated automatically at compile time using
serde-reflection – the exporter introspects your Rust types and produces JSON Schema
definitions that Foxglove can use to understand the data structure.
Each MCAP message contains:
payload– Your task’s output, serialized as JSON.tov– The time of validity.process_time– Start and end timestamps of the task’sprocess()call.status_txt– Any status text the task set.
Inspecting MCAP files
The mcap-info subcommand lets you inspect an MCAP file without opening Foxglove:
cargo run --features logreader-mcap --bin my-project-logreader -- \
    logs/my-project.copper mcap-info data.mcap
=== MCAP File Info ===
File: data.mcap
Size: 2617 bytes (0.00 MB)

=== Statistics ===
Total messages: 9
Channels: 3
Schemas: 3

=== Channels ===
  /sink [json] (schema: copper.sink): 3 messages
  /src [json] (schema: copper.src): 3 messages
  /t_0 [json] (schema: copper.t_0): 3 messages

=== Schemas ===
Schema: copper.sink (encoding: jsonschema)

Schema: copper.src (encoding: jsonschema)

Schema: copper.t_0 (encoding: jsonschema)
Add --schemas to print the full JSON Schema for each channel, or -n 3 to show the
first 3 sample messages per channel:
cargo run --features logreader-mcap --bin my-project-logreader -- \
    logs/my-project.copper mcap-info data.mcap --schemas -n 1
Opening in Foxglove
Once you have an .mcap file, open it in Foxglove:
- Go to app.foxglove.dev (or use the desktop app).
- Click “Open local file” and select your
.mcapfile. - Your channels (
/src,/t-0, etc.) appear in the sidebar. - Add a Raw Messages panel to see the JSON payloads, or a Plot panel to graph numeric fields over time.
Because the MCAP file includes JSON Schema definitions, Foxglove knows the structure of your messages and can offer autocomplete for field names in plots.
Foxglove has plenty of tutorials on how to set up the Panels. Here is a basic UI showing our data with plots and raw messages:
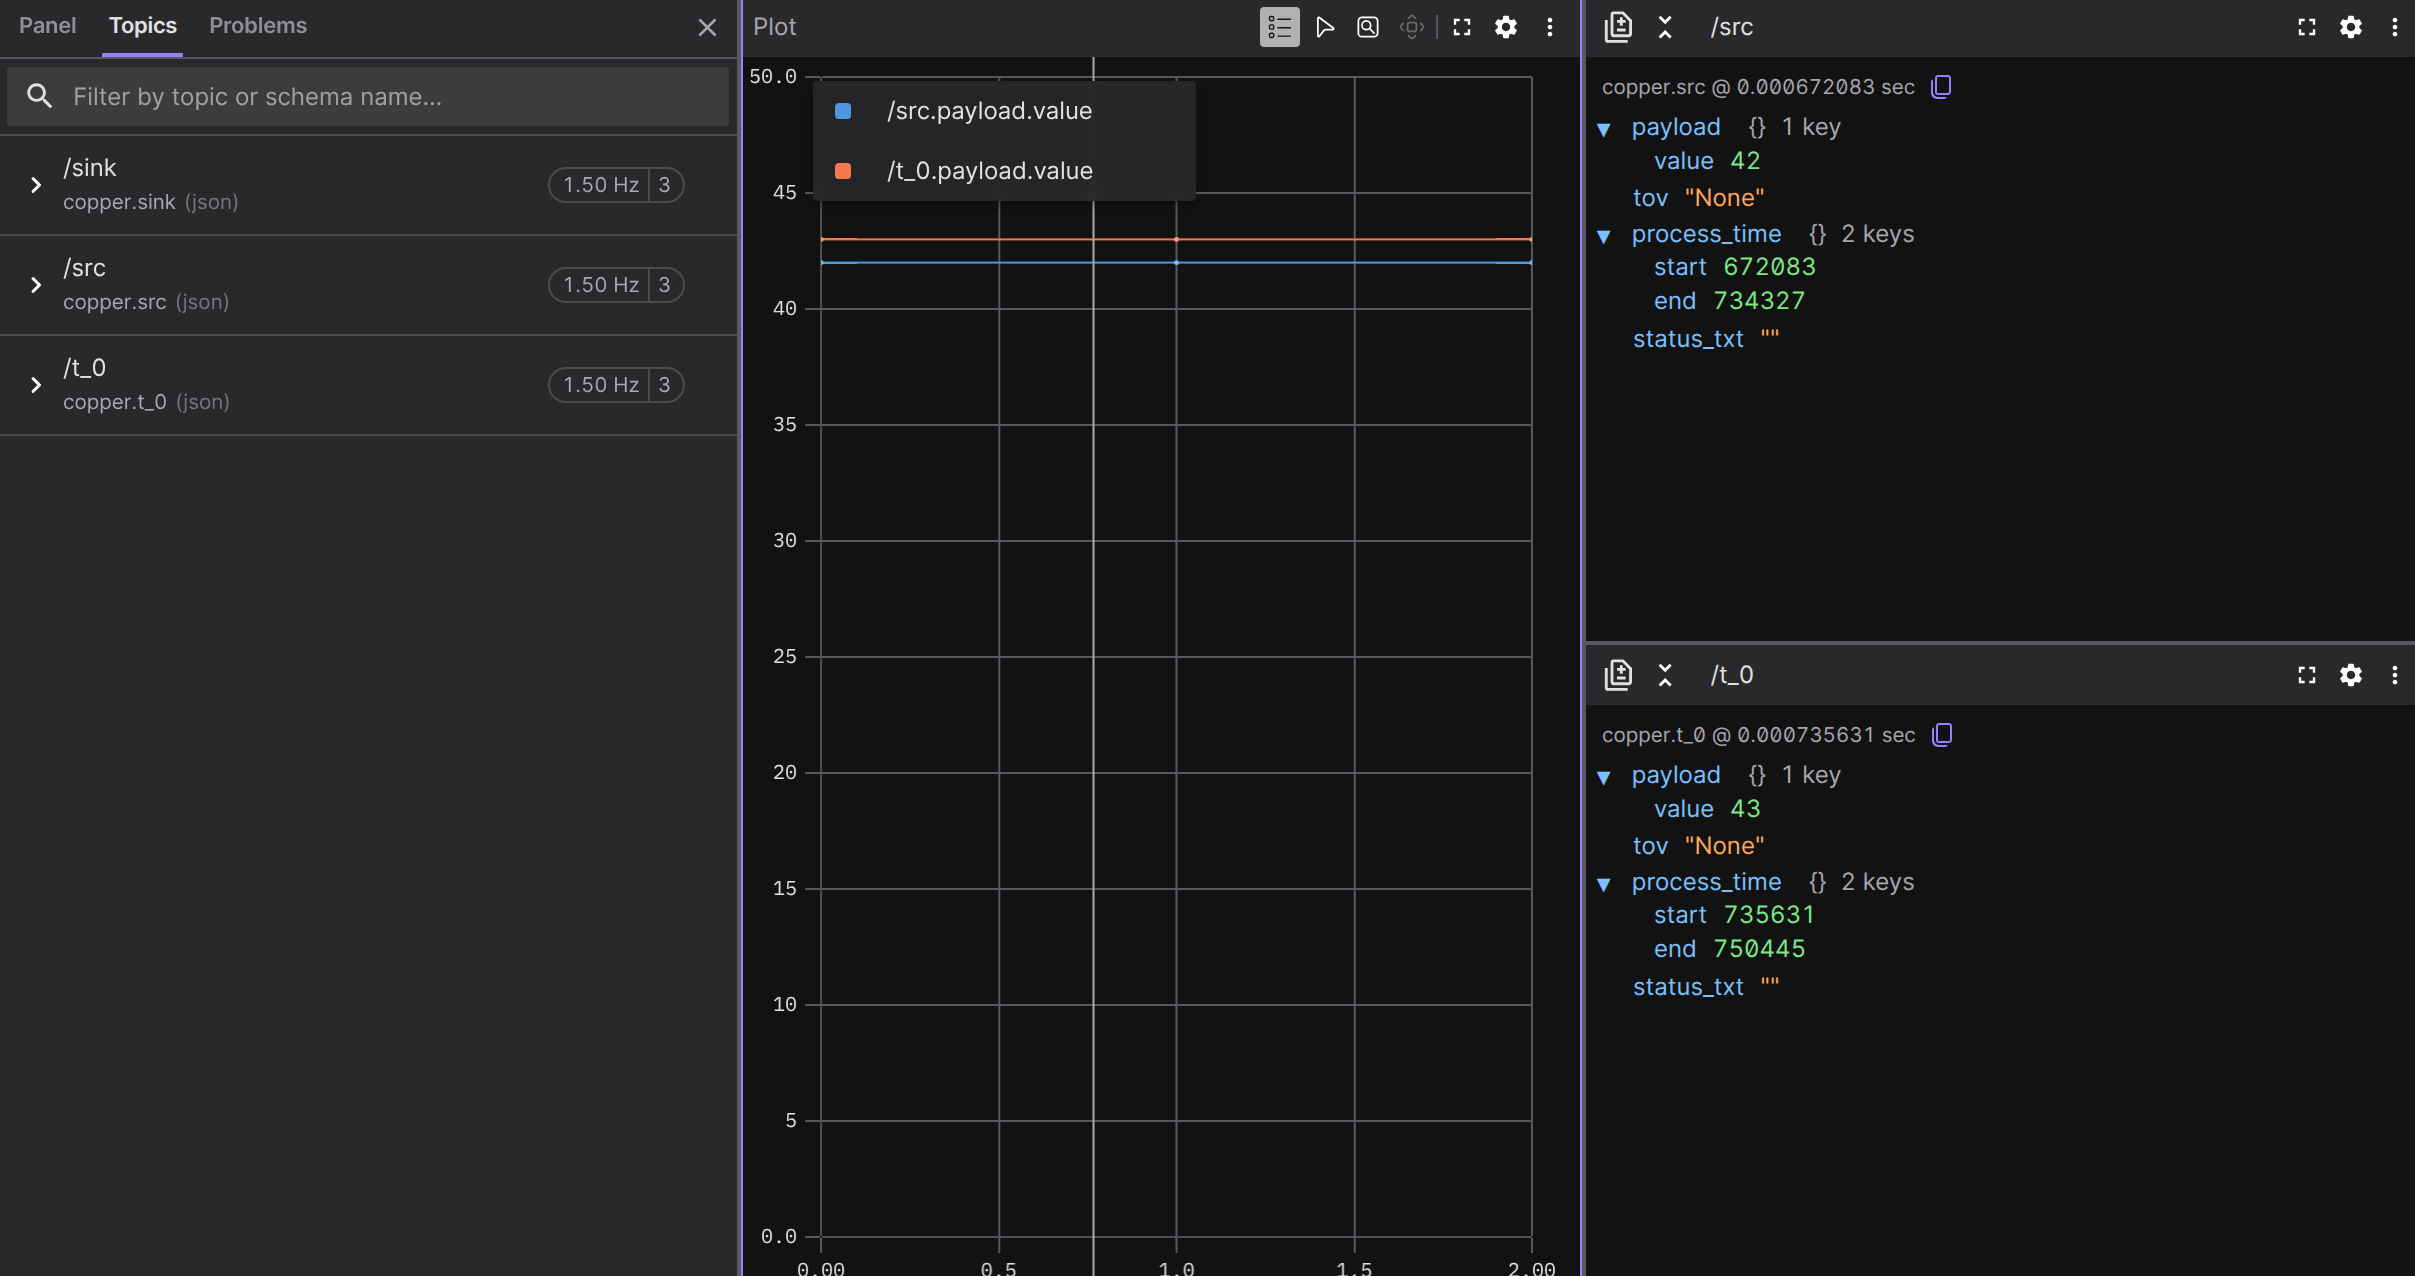
Summary of subcommands
Here’s a quick reference for all the log reader subcommands:
| Subcommand | What it does | Feature needed |
|---|---|---|
extract-text-log <index> | Reconstructs human-readable text logs | – |
extract-copperlists | Dumps CopperList data (JSON or CSV) | – |
extract-copperlists -e csv | Dumps CopperList data as CSV | – |
fsck | Checks log integrity and prints statistics | – |
log-stats | Computes per-edge statistics as JSON | – |
export-mcap --output f.mcap | Exports to MCAP format for Foxglove | mcap |
mcap-info <file> | Inspects an MCAP file | mcap |
Useful Resources
Throughout this book, we’ve been learning Copper by building projects step by step. But the copper-rs repository itself is a goldmine of resources that go far beyond what we’ve covered. This chapter is a guided tour of where to find documentation, examples, and tools in the copper-rs repository.
Official documentation
The Copper project maintains a documentation site with detailed guides on every aspect of the framework:
copper-project.github.io/copper-rs
Here are the most useful pages:
| Page | What you’ll find |
|---|---|
| Copper Application Overview | Full walkthrough of a task graph and runtime |
| Copper RON Configuration Reference | Complete schema for copperconfig.ron |
| Task Lifecycle | Detailed explanation of new, start, process, stop |
| Modular Configuration | Includes, parameter substitution, composition |
| Build and Deploy | Building for different targets and deploying |
| Supported Platforms | What hardware and OS combinations are supported |
| Baremetal Development | Running Copper on microcontrollers without an OS |
| Copper Component Catalog | Live catalog of drivers, algorithms, and bridges |
| FAQ | Common questions and answers |
Bookmark the configuration reference in particular – it’s the definitive source for every
field you can put in copperconfig.ron.
The examples/ directory
The repository ships with a large collection of working examples. Each one is a complete,
buildable project with its own copperconfig.ron, task implementations, and main.rs.
When you want to learn a new feature, reading the corresponding example is often the
fastest way to understand how it works in practice.
Browse them at github.com/copper-project/copper-rs/tree/master/examples, or run any example from the repository root:
cargo run -p cu_missions
Project templates
We used cu_project (see Setting Up Your Environment) and cu_full (see From Project to Workspace) to scaffold our projects, but
the bundled template tree has more to offer:
support/cargo_cunew/templates/
├── cu_project/     # Simple single-crate project
├── cu_full/        # Multi-crate workspace with components
└── README.md       # Detailed usage guide
The support/cargo_cunew/templates/README.md guide documents both cargo cunew and the
direct cargo generate developer path, including the just gen-workspace / just gen-project
shortcuts for template work inside the repo.
Docker images
The support/docker/ directory contains Dockerfiles for building Copper projects in
containerized environments:
Dockerfile.ubuntu– Standard Ubuntu-based build environmentDockerfile.ubuntu-cuda– Ubuntu with CUDA support for GPU-accelerated tasks
These are useful for CI pipelines or for building on machines where you don’t want to install the full Rust toolchain.
Cross-compilation support
The support/ directory also includes helpers for cross-compiling and deploying to
embedded targets:
just cross-armv7-deploy     # Build and deploy to ARMv7 (e.g., Raspberry Pi)
just cross-riscv64-deploy   # Build and deploy to RISC-V 64
These commands build release binaries for the target architecture and scp them to the
robot along with the copperconfig.ron.
The Discord
Finally, the Copper project has an active Discord server where you can ask questions, share your projects, and get help from the community and the framework authors.
Python Support
Copper has first-class Python support, but there are two very different ways to use it.
If you only remember one thing from this chapter, remember this:
Python for offline log analysis is reasonable. Python on the live task path is a prototyping hack and should not be treated as a production architecture.
Offline Python Analysis
Copper can expose recorded .copper data to Python after the run:
- structured text logs
- runtime lifecycle records
- app-specific typed CopperLists
This is the good Python workflow in Copper because it stays off the runtime path. The robot runs normally in Rust, Copper records everything, and Python inspects the results later.
Typical use cases:
- notebooks
- one-off analysis scripts
- extracting selected fields from a log
- integrating recorded Copper data into an existing Python data science workflow
The cu_flight_controller example shows the pattern:
- Rust exposes an app-specific PyO3 module in
src/python_module.rs - Python imports that module and reads typed CopperLists from the unified log
Runtime Python Tasks
Copper also provides cu-python-task, which lets one task delegate its
process(...) body to a Python script.
This is intentionally a prototyping feature, not a performance feature.
The reason is simple: as soon as Python enters the live execution path, you lose the main properties Copper is designed to preserve:
- low latency
- low jitter
- predictable allocation behavior
- tight control over the realtime path
Python allocates constantly, and the Rust/Python boundary adds even more overhead. That is enough to ruin the realtime characteristics of the stack. Compared to a native Rust Copper task, the performance is abysmal.
The Two Execution Modes
process
In process mode, Copper spawns a separate Python interpreter and exchanges length-prefixed CBOR frames over stdin/stdout.
Advantages:
- the GIL is not inside the Copper process
- interpreter failures are more isolated
Costs:
- CBOR serialization and deserialization every cycle
- copies and allocations every cycle
- interprocess overhead
- more latency and jitter
embedded
In embedded mode, Copper calls Python directly inside the process through PyO3.
Advantages:
- no child process
- no extra CBOR IPC layer
- usually somewhat less overhead than
process
Costs:
- the GIL is now inside the Copper process
- Python exceptions happen inside the runtime process
- values still have to be converted and allocated every cycle
- still not suitable for realtime use
In this workspace, embedded mode is also not supported on macOS.
What It Is Actually For
The intended workflow is narrow:
- prototype one task quickly in Python
- confirm the algorithm is doing the right thing
- rewrite that task in Rust immediately afterward
If you want, you can use an LLM to draft the Rust rewrite once the Python behavior is stable. But the final destination should still be Rust, not a permanent Python task.
Use this feature as a disposable bridge, not as the architecture.
Performance Basics
This chapter should serve two different readers:
- If you already know how Copper executes a cycle and you just want the knobs, jump to Tuning Knob Reference.
- If you are still building the mental model, read straight through, then continue to Troubleshooting Performance.
Start with one simple idea
By default, Copper runs one CopperList at a time on one thread.
That is the baseline model. Most performance questions are just variations of:
- is one task too slow?
- is the end of the CopperList too slow?
- is the OS getting behind on disk writeback?
- does this graph have enough CPU work to profit from overlap?
Those are different problems, so they do not use the same tuning knob.
What one Copper cycle looks like
At a high level, one cycle looks like this:
- Create or reuse a CopperList.
- Run the generated DAG in topological order.
- Record timings and monitoring data.
- Serialize and log the completed CopperList.
- Recycle the CopperList and start the next cycle.
That last part is important. Even when the task path is fast, the cycle is not really over until Copper has dealt with the finished CopperList.
Two places where time is spent
When a user says “my loop is too slow”, the time is usually being lost in one of two places:
Inside the DAG
This means one or more tasks are expensive.
Typical signs:
- one task dominates the LAT tab
- end-to-end latency is high because task execution itself is high
Typical fixes:
- optimize one task
- run one task in the background
- parallelize inside one task
- use
parallel-rtif the graph is a long CPU pipeline
After the DAG finishes
This means the task work is acceptable, but the completed CopperList is expensive to finish.
Typical signs:
- task latencies look acceptable
- the BW tab shows significant serialization or disk cost
Typical fixes:
async-cl-io- reducing logged data
mmap-fsyncif the problem appears later under writeback pressure
What Copper does with the finished CopperList
Copper’s unified logger writes the finished CopperList to a memory-mapped log.
By default:
- the task outputs are serialized at the end of the cycle
- the logger writes to memory-mapped slabs
- when a section is closed, Copper asks the OS to flush that range asynchronously
This is usually fast enough, but it creates an important beginner trap:
- the system can look fine at first
- dirty pages accumulate in the background
- later, the machine starts paying the bill
So “it collapses after a while” is often a logging and writeback story, not a task story.
What to do next
Once this mental model is clear, do not keep guessing. Look at the numbers:
The normal flow should be:
- understand the baseline model
- inspect LAT, BW, MEM, and
log-stats - follow the troubleshooting tree
- only then choose a tuning knob
Tuning Knob Reference
This is the fast path for readers who already know what kind of bottleneck they have.
| Knob | What it changes | Typical symptom |
|---|---|---|
async-cl-io | Moves CopperList serialization and logging to a dedicated thread | Task latencies are fine, but end-of-CL overhead is too high |
parallel-rt | Pipelines multiple CopperLists across generated process stages | Several CPU-bound stages are back to back and the global rate is too low |
mmap-fsync | Forces file sync_all() on section flush | The system runs fine for a while, then collapses under dirty-page / writeback pressure |
background: true | Runs one compatible source or task on the background threadpool and returns None while it is still busy | One isolated stage is too slow, but it does not need to block every cycle |
Task-local thread pool / parallel for | Parallelizes the internals of one task | One hot task has obvious internal data parallelism |
logging: (enabled: false) or enable_task_logging: false | Reduces logged bytes | Bandwidth and serialized size are too high |
logging.copperlist_count | Increases the number of preallocated in-flight CopperLists | Async or parallel modes stall because they run out of CopperList slots |
Feature switches
The runtime features are Cargo features on cu29. A simple way to expose them in your app is
to forward them from your crate:
[features]
async-cl-io = ["cu29/async-cl-io"]
parallel-rt = ["cu29/parallel-rt"]
mmap-fsync = ["cu29/mmap-fsync"]
Then you can run:
cargo run --features async-cl-io
cargo run --features parallel-rt
cargo run --features mmap-fsync
Two distinctions that matter
parallel-rt is not the same as background: true
parallel-rt is a runtime-level pipeline. Multiple CopperLists can be in flight at the
same time, and each generated process stage keeps FIFO order for determinism.
background: true is a stage-level escape hatch. One source or task moves to the
background threadpool and may return None for some cycles while its previous run is still
finishing.
parallel-rt is not the same as task-local parallelism
parallel-rt parallelizes the DAG across CopperLists.
Task-local parallelism parallelizes the inside of one task.
If one task is much heavier than the rest, fixing that task directly is often better than adding runtime-level parallelism around it.
Background tasks and the threadpool bundle
If a source or task is marked with background: true, Copper ensures a threadpool resource bundle is
available. If you do not provide one explicitly, the runtime creates a default one.
This makes background stages easy to turn on, but it does not mean they are always the right choice. They work best when skipping or sampling intermediate cycles is acceptable.
Reading Performance Metrics
Performance tuning starts with the right numbers. In Copper, the useful views are already built in:
- live, in the console monitor
- offline, from
log-stats
If you have not added the monitor yet, start with Adding the Console Monitor. If you want offline stats from a log, see Exporting Data to Other Formats.
Live signals
LAT tab
Use the latency tab when you want to know whether the problem is inside the DAG itself.
Look for:
- one task with a much larger mean or max than the others
- high jitter on one task
- a high End2End latency even though no single task stands out
What it usually means:
- one hot task: optimize that task, background it, or parallelize inside it
- many moderate CPU-bound tasks in a row: consider
parallel-rt
BW tab
Use the bandwidth tab when the DAG seems fine but the loop still feels too expensive.
This tab is the first place to look for:
- observed loop rate
- CopperList size
- raw memory throughput
- serialized size
- total disk write rate
What it usually means:
- latency is fine, but BW is high at the end of the cycle: consider
async-cl-io - disk / encoding numbers are simply too large: reduce what you log
- numbers are fine for a while, then the machine slows down: suspect writeback pressure and
test
mmap-fsync
MEM tab
Use the memory pools tab when the system looks unstable or starts failing only under load.
Look for:
- used buffers close to total buffers
- handles in use staying high
- obvious pool exhaustion
What it usually means:
- increase pool sizes
- reduce how long buffers stay alive
- if many CopperLists are in flight, check whether your pool sizing still makes sense
Offline signals with log-stats
The log-stats command adds two kinds of evidence:
- pipeline timing in
perf - per-edge size and throughput in
edges
Typical command:
cargo run --features logreader --bin my-project-logreader -- \
    logs/my-project.copper log-stats --output stats.json --config copperconfig.ron
The most useful fields for tuning are:
| Field | Why it matters |
|---|---|
perf.end_to_end.* | Confirms real pipeline latency over a recorded session |
perf.jitter.* | Shows whether the problem is mostly spikes rather than mean cost |
edges[].avg_raw_bytes | Shows which edge is large |
edges[].throughput_bytes_per_sec | Shows which edge is pushing the most sustained traffic |
edges[].rate_hz | Shows whether the effective rate on that edge matches your expectation |
edges[].none_samples | Useful when a task sometimes emits nothing, especially with background behavior |
Symptom to first metric
| Symptom | Check first |
|---|---|
| “The loop is too slow” | LAT tab, then End2End in log-stats |
| “Tasks look fine but the cycle still ends late” | BW tab |
| “It works for a while, then degrades” | BW tab over time, then test mmap-fsync |
| “One task is clearly the culprit” | LAT tab row for that task |
| “A specific edge is too heavy” | avg_raw_bytes and throughput_bytes_per_sec in log-stats |
| “The system fails only under load” | MEM tab |
| “Async or parallel mode did not help much” | Check whether logging.copperlist_count is too low |
A simple workflow
- Start with the LAT tab and BW tab.
- Confirm the hypothesis with
log-stats. - Change one knob at a time.
- Re-run and compare the same metrics.
Then use the decision tree:
Troubleshooting Performance
This chapter is meant to be navigated. Start at the first question and follow the links.
Before you start:
- use the LAT, BW, and MEM tabs from Adding the Console Monitor
- if you need offline evidence, generate
stats.jsonwithlog-stats
Start Here
Q1: Are you missing your target rate?
Q2: Are you actually rate-limited by config?
Check runtime.rate_target_hz.
Q3: Is one task clearly dominating the latency tab?
Q4: Can that task finish later without blocking every cycle?
Q5: Do you have a long CPU-bound pipeline?
Think: several pure compute stages back to back, little blocking I/O, little waiting on hardware.
Q6: Is the problem mostly end-of-CopperList overhead or late collapse?
- Large end-of-cycle overhead right away, while task latencies are acceptable:
Enable
async-cl-io - The system runs well at first, then degrades over time:
Enable
mmap-fsync - Neither: Continue to Q7
Q7: Are you pushing too much data?
Check the BW tab and log-stats:
-
large serialized CopperLists
-
high disk write rate
-
one edge with large
avg_raw_bytesorthroughput_bytes_per_sec
Q8: Are you running out of buffers or in-flight CopperLists?
- Pool pressure in MEM tab: Tune memory pools
- Too few in-flight CopperLists for async or parallel execution: Increase CopperList slots
- Neither: Reduce thread oversubscription
Outcomes
Rate Target Is the Limiter
If runtime.rate_target_hz is lower than the rate you want, Copper is doing exactly what you
asked.
runtime: (
    rate_target_hz: 100,
),
If you need a higher rate:
- raise
rate_target_hz - or remove it and run at best effort
If the system starts missing deadlines after that change, go back to Q3 or Q5.
Enable async-cl-io
Use this when the task path is fine, but the end of the CopperList is too expensive.
What it does:
- keeps the DAG execution on the main loop
- queues the completed CopperList to a dedicated serializer thread
- recycles the slot later when serialization finishes
Minimal feature forwarding:
[features]
async-cl-io = ["cu29/async-cl-io"]
cargo run --features async-cl-io
Good fit:
src -> task_a -> task_b -> sink

The LAT tab looks acceptable, but BW shows large serialized CL cost.
Bad fit:
src -> huge_cpu_task -> sink

The hot spot is inside huge_cpu_task itself. Moving CL serialization off-thread does not fix that.
Two checks after enabling it:
- if the benefit is small, your real bottleneck is elsewhere
- if the serializer now waits for free CopperLists, raise
logging.copperlist_count
Enable parallel-rt
Use this when you have several CPU-bound stages back to back and want higher global throughput.
What it does:
- keeps deterministic FIFO order per generated process stage
- lets multiple CopperLists be in flight at the same time
- turns the runtime into a stage pipeline instead of a strictly one-CL-at-a-time loop
Minimal feature forwarding:
[features]
parallel-rt = ["cu29/parallel-rt"]
cargo run --features parallel-rt
Good fit:
src -> cpu_a -> cpu_b -> cpu_c -> cpu_d -> sink
Why:
- many stages can work on different CopperLists at the same time
- no single stage is overwhelmingly larger than the others
Bad fit:
src -> giant_cpu_task -> sink
Why:
- the giant task is still the throughput limiter
- you usually get more by optimizing or parallelizing that task directly
Also a poor fit:
camera -> wait_for_io -> bridge -> sink
Why:
- the graph is dominated by waiting and I/O, not by a CPU pipeline
Two checks after enabling it:
- if workers look idle, you may need a larger
logging.copperlist_count - if throughput does not move, the graph probably lacks enough useful overlap
Enable mmap-fsync
Use this when the system runs well for a while, then starts degrading, and you suspect the OS is accumulating too many dirty pages from the memory-mapped logger.
What it does:
- keeps the memory-mapped logger
- adds synchronous file
sync_all()on section flush - trades peak throughput for more explicit writeback
Minimal feature forwarding:
[features]
mmap-fsync = ["cu29/mmap-fsync"]
cargo run --features mmap-fsync
Good fit:
The robot behaves well for a while, BW looks reasonable, then the machine starts stalling.
Bad fit:
The loop is already compute-bound from the first second.
After enabling it, measure the cost. If the throughput penalty is too large:
- reduce what you log
- experiment with
section_size_mibandslab_size_mib - or accept the default async writeback and provision the storage path better
Background One Task
Use this when one isolated source or task is too slow, but it does not need to block the whole loop.
(
    id: "heavy",
    type: "tasks::HeavyTask",
    background: true,
),
What it means semantically:
- Copper runs that source or task on the background threadpool
- while it is still busy,
process()returnsNone - downstream tasks therefore see missing output for some cycles
Good fit:
src -> heavy_optional_stage -> sink
Why:
- it is acceptable for the stage to sample or skip intermediate cycles
Bad fit:
src -> estimator -> controller -> actuator
Why:
- the controller path usually needs one coherent output per cycle
Copper will ensure a threadpool resource bundle exists when background sources or tasks are present.
If you need a specific sizing, provide that bundle explicitly instead of relying on the
default.
Parallelize Inside One Task
Use this when the real bottleneck is inside one task, not in the DAG structure.
Typical cases:
- per-pixel or per-point computation
- large reduction or map kernels
- CPU-heavy loops that can be split cleanly
Preferred approach:
- keep the DAG simple
- add a thread pool in resources or use a controlled parallel loop inside the task
- measure the task again in the LAT tab
Good fit:
src -> expensive_image_task -> sink
Bad fit:
The real issue is serialized logging or OS writeback.
Reduce Logging Volume
Use this when BW and log-stats show that the logger is simply carrying too much data.
The first lever is per-task logging:
(
    id: "fast-sensor",
    type: "tasks::FastSensor",
    logging: (enabled: false),
),
The second lever is global task logging:
logging: (
    enable_task_logging: false,
),
Good fit:
One or two high-rate edges dominate avg_raw_bytes and throughput_bytes_per_sec.
Bad fit:
The hot spot is a CPU-heavy task, but the logged payloads are small.
The practical rule is simple:
- keep logging on for the edges you actually need for replay or diagnosis
- turn it off for bulky intermediate traffic first
Increase CopperList Slots
Use this when async or parallel execution is underfilled because there are not enough preallocated CopperLists available.
logging: (
    copperlist_count: 8,
),
This value is consumed by the generated runtime, so it needs to be compiled into the binary.
Good fit:
async-cl-io or parallel-rt is enabled, but the runtime still behaves as if only a tiny number
of CopperLists can be active.
Bad fit:
The graph has no useful overlap to exploit.
More slots help only when there is real work to overlap.
Tune Memory Pools
Use this when the MEM tab shows pressure on pooled buffers or handles.
Good fit:
handle-backed payloads stay alive across several stages and the pool remains near full.
Actions:
- increase pool size
- reduce payload lifetime
- reduce the number of simultaneously retained CopperLists if that is what keeps the buffers alive
Bad fit:
The pool is healthy and the real issue is CPU or disk.
Reduce Thread Oversubscription
Use this when you stacked too many concurrency mechanisms at once:
parallel-rt- several
background: truetasks - task-local Rayon pools or custom worker pools
Symptoms:
- throughput does not improve
- jitter gets worse
- the machine is busy, but the useful rate barely moves
The fix is usually to simplify first:
- use
parallel-rtfor DAG-level overlap - use
background: truefor one isolated non-blocking stage - use task-local parallelism for one hot algorithm
Do not enable all three everywhere by default.