Logging and Replaying Data
Every time you’ve run our project so far, Copper has been quietly recording everything.
Look at main.rs – the generated app builder’s .with_log_path(...) call initializes a unified logger
that writes to logs/my-project.copper. Every cycle, the runtime serializes every message
exchanged between tasks (the CopperList) and writes it to that file.
In this chapter, we’ll explore what’s in that log file, how to read it back, and how to replay recorded data through the pipeline.
What gets logged?
Copper’s unified logger captures two kinds of data in a single .copper file:
-
Structured text logs – Every
debug!(),info!(),warn!(), anderror!()call from your tasks. These are stored in an efficient binary format (not as text strings), so they’re extremely fast to write and compact on disk. -
CopperList data – The complete set of message payloads exchanged between tasks in each cycle. In our project, that means every
MyPayload { value: 42 }fromMySourceand everyMyPayload { value: 43 }fromMyTask, along with precise timestamps.
This is different from most robotics frameworks where logging is opt-in and you have to explicitly record topics. In Copper, every message is logged by default. The runtime does this automatically as part of its execution loop – no extra code needed.
Typed logging codecs
v1.0
A task’s logging.codec or logging.codecs setting selects a typed codec for its
recorded payloads, such as lossless PNG or FFV1 image compression. This lets the
encoding follow the payload’s structure while keeping codec selection in RON.
Keep the logreader built for the application version that produced a recording. The codec’s representation is part of the encoded content, whose layout can change between application versions. The unified-log file and section header version describes the outer storage layout.
Step 1: Generate a log file
Make sure your project is in the state from the previous chapters, with the 1 Hz rate
limiter. Here’s the copperconfig.ron for reference:
(
    tasks: [
        (
            id: "src",
            type: "tasks::MySource",
        ),
        (
            id: "t-0",
            type: "tasks::MyTask",
        ),
        (
            id: "sink",
            type: "tasks::MySink",
        ),
    ],
    cnx: [
        (
            src: "src",
            dst: "t-0",
            msg: "crate::tasks::MyPayload",
        ),
        (
            src: "t-0",
            dst: "sink",
            msg: "crate::tasks::MyPayload",
        ),
    ],
    runtime: (
        rate_target_hz: 1,
    ),
)
Note: If you still have the
monitorsection from the previous chapter, remove it for now. The console monitor takes over the terminal and makes it harder to see the debug output.
Run the project and let it execute for 5-10 seconds, then press Ctrl+C:
cargo run
00:00:03.9986 [Debug] Received message: 42
00:00:03.9987 [Debug] Sink Received message: 43
00:00:04.9979 [Debug] Source at 4997916
00:00:04.9980 [Debug] Received message: 42
00:00:04.9981 [Debug] Sink Received message: 43
...
After stopping, check the logs/ directory:
ls -lh logs/
-rw-r--r-- 1 user user 4.0K logs/my-project.copper
That .copper file contains everything: every message, every timestamp, every debug line.
Note: The log path is hardcoded to
"logs/my-project.copper"inmain.rs. Each run overwrites the previous log file – there is no automatic rotation or timestamping. If you want to keep a log from a previous session, rename or move the file before running the project again.
Step 2: The log reader
If you look at your project, you’ll notice there’s already a file you haven’t used yet:
src/logreader.rs. The project template ships with a built-in log reader. Let’s look at
it:
pub mod tasks;

use cu29::prelude::*;
use cu29_export::run_cli;

// This will create the CuStampedDataSet that is specific to your copper project.
// It is used to instruct the log reader how to decode the logs.
gen_cumsgs!("copperconfig.ron");

#[cfg(feature = "logreader")]
fn main() {
    run_cli::<CuStampedDataSet>().expect("Failed to run the export CLI");
}
This is a small but powerful program. Let’s break it down:
gen_cumsgs!("copperconfig.ron") – This macro reads your task graph and generates a
CuStampedDataSet type that knows the exact message types used in your pipeline. The log
reader needs this to decode the binary data in the .copper file – without it, the bytes
would be meaningless.
run_cli::<CuStampedDataSet>() – This is Copper’s built-in export CLI. It provides
several subcommands for extracting data from .copper files. By passing the generated
CuStampedDataSet type, you tell it exactly how to decode your project’s messages.
#[cfg(feature = "logreader")] – The log reader is gated behind a Cargo feature flag
so its dependencies (like cu29-export) are only compiled when you actually need them.
Step 3: Extract text logs
The first thing you can do with the log reader is extract the structured text logs – the
debug!() messages from your tasks. Remember, these aren’t stored as text in the
.copper file; they’re stored as compact binary indices. The log reader reconstructs the
human-readable text using the string index that was built at compile time.
Run:
cargo run --features logreader --bin my-project-logreader -- \
    logs/my-project.copper extract-text-log target/debug/cu29_log_index
The arguments are:
logs/my-project.copper– The log file to readextract-text-log– The subcommand to extract text logstarget/debug/cu29_log_index– The path to the string index directory (generated during compilation bybuild.rs)
You’ll see output like:
25.501 µs [Debug]: Logger created at logs/my-project.copper.
45.903 µs [Debug]: Creating application...
64.282 µs [Debug]: CuConfig: Reading configuration from file: copperconfig.ron
669.067 µs [Debug]: Running... starting clock: 666.866 µs.
823.766 µs [Debug]: Source at 822
870.122 µs [Debug]: Received message: 42
887.054 µs [Debug]: Sink Received message: 43
1.000 s [Debug]: Source at 1000206
1.000 s [Debug]: Received message: 42
1.000 s [Debug]: Sink Received message: 43
2.000 s [Debug]: Source at 1999631
...
This is the same output you saw scrolling by when the application was running – but reconstructed from the binary log after the fact.
Step 4: Extract CopperLists
The more interesting subcommand extracts the CopperList data – the actual message payloads from every cycle:
cargo run --features logreader --bin my-project-logreader -- \
    logs/my-project.copper extract-copperlists
Serialized CopperLists contain the cycle id and msgs. Lifecycle state is
runtime bookkeeping and is omitted from binary logs, JSON, Python exports, and
remote-debug snapshots. Decode messages with the producing application’s typed
logreader or its embedded catalog; the file encapsulation version describes the
file and section layout.
The output is JSON by default. Here’s what the first CopperList looks like:
{
  "id": 0,
  "msgs": [
    {
      "payload": {
        "value": 42
      },
      "tov": "None",
      "metadata": {
        "process_time": {
          "start": 822050,
          "end": 867803
        },
        "status_txt": ""
      }
    },
    {
      "payload": {
        "value": 43
      },
      "tov": "None",
      "metadata": {
        "process_time": {
          "start": 869282,
          "end": 885259
        },
        "status_txt": ""
      }
    }
  ]
}
Every message from every cycle is there, exactly as it was produced. Each entry in msgs
corresponds to a connection in your task graph (in order: src→t-0, then t-0→sink).
Along with the payload, you get:
metadata.process_time– The start and end timestamps (in nanoseconds) of the task’sprocess()call that produced this message. This is the same timing data the console monitor uses for its latency statistics.tov– “Time of validity”, an optional timestamp that the task can set to indicate when the data was actually captured (useful for hardware drivers with their own clocks).status_txt– An optional status string the task can set for diagnostics.
This is the raw data you’d use for offline analysis, regression testing, or replay.
Why this matters: replay
Recording data is useful for post-mortem analysis, but the real power of Copper’s logging is deterministic replay. Because every message and its timestamp is recorded, you can feed logged data back into the pipeline and reproduce the exact same execution – without any hardware.
This means you can:
- Debug without hardware: Record a session on the real robot, then replay it on your laptop to test processing logic.
- Regression test: Record a known-good session, then replay it after code changes to verify the pipeline still produces the same results.
- Analyze edge cases: When your robot encounters an unusual situation, the log captures it. You can replay that exact moment over and over while you debug.
The key insight is that all downstream tasks don’t know the difference – they receive
the same MyPayload messages with the same timestamps, whether they come from live
hardware or a log file.
Remote debug and Time Traveler
When exported CopperLists are not enough, a replay binary can expose the log through Copper’s remote debug API. A debugger such as Time Traveler can then seek or step through the timeline, replay batches, inspect task state, query message schemas, and read structured logs from the same session.
Replay CLI and structured log queries
v1.0 Replay targets use three standard arguments:
--debug-base <zenoh-prefix>
--log-base <recorded-log>
--replay-log-base <replay-output>
Replay and remote-debug servers should be optimized. A normal Cargo dev build is unoptimized and can make seeking, stepping, payload decoding, and state inspection much slower. Copper’s generated projects therefore define this profile:
[profile.debug-optimized]
inherits = "dev"
opt-level = 3
debug = 2
debug-assertions = true
The generated just resim and just resim-debug recipes select it with
--profile debug-optimized. This keeps Copper debug!() structured log entries, debug
assertions, and debugger information while optimizing the replay server. Use the same
profile for hand-written replay recipes rather than running the server with Cargo’s
unoptimized dev profile.
Application replay binaries normally use cu29::replay::ReplayCli, or flatten
ReplayArgs into a larger CLI. The most useful remote methods are:
nav.seek,nav.step, andnav.replayfor navigationtimeline.get_clandtimeline.listfor recorded messages and timingstate.inspect,state.read, andstate.searchfor task stateschema.get_typeandschema.get_outputsfor debugger-driven renderinglogs.stringsandlogs.listfor structured logs
Session leases and deferred payloads
v1.1
Each replay server grants one active debug-session lease. While the debugger is otherwise
idle, it sends health.ping with the active session_id every second. Any session-scoped
request also renews the lease. After 3 seconds without session activity, the server
automatically closes the session so the debugger can reconnect after a crash or lost
connection. A second session.open returns SessionBusy while the lease is active.
To inspect two logs or maintain two independent timeline cursors concurrently, launch two
replay-server processes with different --debug-base and --replay-log-base values.
Handle-backed payloads stay lazy. A normal response contains only a compact CuHandle
descriptor. When a CBOR request explicitly sets include_handle_contents: true, selected
handle buffers are returned out of line in the response’s attachments array. This lets
an inspector load a camera frame or point cloud on demand without copying every large
buffer while it scrubs the timeline.
The debug value format preserves values that JSON alone cannot represent faithfully,
including 128-bit integers, non-finite floats, and maps with non-string keys. Schema
queries describe enums, maps, and fixed-capacity CuArrayVec values, and
schema.get_outputs supports paging output slots and their field catalogs separately.
Linux shared-memory setup
v1.1
On Linux, the default local remote-debug transport uses a 1 GiB Zenoh shared-memory pool
and requires replies of 256 KiB or larger to use SHM. Both the Copper process and the
debugger need sufficient RLIMIT_MEMLOCK, and /dev/shm must have room for the pool.
Configure the launching shell before starting either process:
sudo prlimit --pid $$ --memlock=2147483648:2147483648
ulimit -l 2097152
df -h /dev/shm
The ulimit -l value is in KiB. For systemd use LimitMEMLOCK=2G; for Docker configure
both --ulimit memlock=2147483648:2147483648 and --shm-size=2g.
Copper checks these resources at startup and refuses to silently copy a large reply over
the Unix socket when SHM allocation fails. Tests can use a smaller explicit
RemoteDebugShmConfig on both server and client. Non-Linux platforms retain the previous
4 MiB pool and 3 KiB threshold without Linux-specific preflight.
How the unified logger works under the hood
Copper’s logger is designed for zero-impact logging on the critical path. Here’s how:
-
Pre-allocated memory slabs – At startup,
.with_log_path(...)allocates a large contiguous block of memory (controlled byPREALLOCATED_STORAGE_SIZE– 100 MB in our project). CopperLists are written into this pre-allocated buffer without any dynamic allocation. -
Binary serialization – Messages are serialized using
bincode, not formatted as text. This is why your payloads need theEncode/Decodederives. Binary serialization is orders of magnitude faster thanformat!()orserde_json. -
Memory-mapped I/O – The pre-allocated slabs are memory-mapped to the
.copperfile. The OS handles flushing to disk asynchronously, so the robot’s critical path never blocks on disk I/O. -
Structured text logging – Even
debug!()calls don’t format strings at runtime. Instead, Copper stores a compact index and the raw values. The actual string formatting happens only when you read the log – not when you write it. This is why thebuild.rssets upLOG_INDEX_DIR– it’s building a string table at compile time.
This means logging in Copper is almost free on the hot path. You can log everything without worrying about performance – which is exactly why it logs everything by default.
Logging and logstream extensibility
To use a custom payload, codec, storage backend, or packet transport, choose the extension point below. This map follows task messages and state snapshots through the APIs in this edition’s 1.3.0-dev checkout.
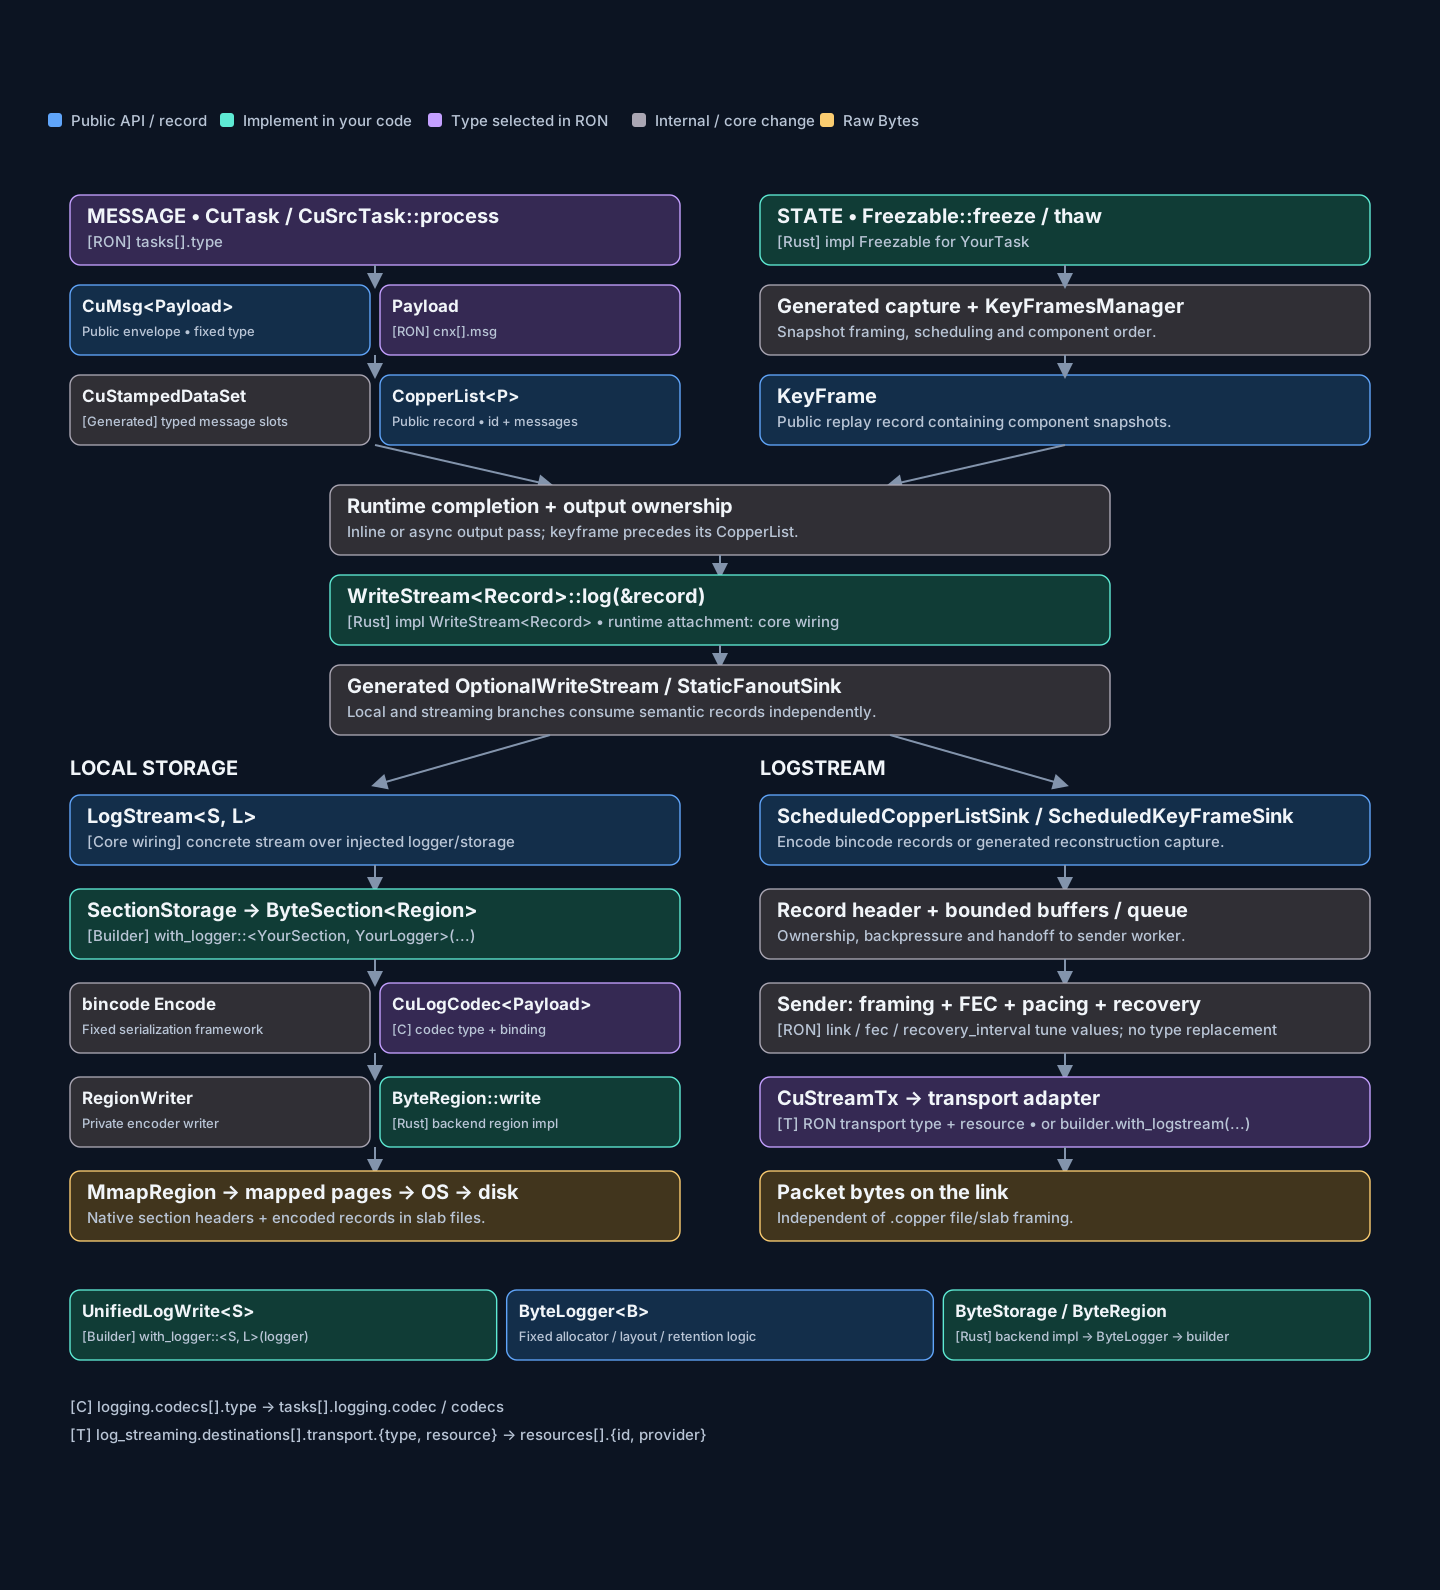
Purple means a Rust type selected in RON: you can name your own implementation. Teal means an implementation supplied in Rust. Blue marks public APIs or records; gray marks core machinery. A setting that only tunes an algorithm does not make that algorithm replaceable.
| Replace or extend | Where to connect your implementation |
|---|---|
| Task | tasks[].type in copperconfig.ron: name your CuTask or CuSrcTask implementation. |
| Message payload | cnx[].msg: name your payload type. The CuMsg envelope stays the same. |
| State snapshot | Implement Freezable::freeze and thaw on your task. Generated capture calls these methods. |
| Payload codec | Define a CuLogCodec<Payload> type in logging.codecs[].type, give it an id, then select that id with tasks[].logging.codec or the per-message logging.codecs map on the task. |
| Logger and section storage | Supply your UnifiedLogWrite<S> and SectionStorage implementations through the generated app’s builder.with_logger::<S, L>(logger). |
| Byte storage backend | Implement ByteStorage and ByteRegion, construct ByteLogger with that backend, and inject it through with_logger. |
| Packet transport | Implement CuStreamTx; select its type and resource through log_streaming.destinations[].transport.{type, resource}. The resource comes from a bundle declared under resources. Rust construction can instead inject the transport with builder.with_logstream(transport, config). |
| Semantic record sink | Implement WriteStream<Record>. Attaching an arbitrary sink to generated app output requires changing the output wiring; there is no RON sink-type slot. |
The payload codec changes payload encoding inside the record; bincode remains
the serialization framework. Likewise, logstream’s link, fec, and
recovery_interval settings tune the built-in sender rather than select a custom
sender algorithm. Replacing those mechanisms requires a core change.
The runtime owns message slots, snapshot order, output handoff, and buffer reuse. Local storage and logstream branch from completed records, so a streaming transport does not need to read the robot’s slab files. For transport wiring and sender settings, continue with Streaming Logs and Live Telemetry and its reference.
Controlling what gets logged
Sometimes you don’t want to log everything. A high-frequency sensor producing megabytes per second can fill up your log storage quickly. Copper provides two ways to control this:
Per-task logging control
In copperconfig.ron, you can disable logging for specific tasks:
(
    id: "fast-sensor",
    type: "tasks::HighRateSensor",
    logging: (enabled: false),
),
This stops the runtime from recording that task’s output messages in the CopperList log. The task still runs normally – it just doesn’t contribute to the log file.
Global logging settings
The logging section in copperconfig.ron lets you tune the logger globally:
logging: (
    slab_size_mib: 1024,
    section_size_mib: 100,
),
Task-state keyframes
v1.2 Task-state keyframes can be disabled independently of CopperList and structured logging:
logging: (
    enable_keyframe_logging: false,
),
This is a compile-time application property. The generated runtime omits keyframe capture code when it is disabled, which is useful for applications whose background workers may still be active at a CopperList boundary. Replay then has message history but no task-state snapshots to restore.
Streaming to a ground station
v1.2 To collect a native archive on another machine while the robot runs, continue to Streaming Logs and Live Telemetry. The guide covers UDP setup, structured robot logs, live task reconstruction, optional receiver feedback, and recovery after packet loss. Per-task logging controls also determine which inputs are available for reconstruction.
Difference with ROS
In ROS, data recording is a separate tool: rosbag2. You start a ros2 bag record
process alongside your running nodes, tell it which topics to subscribe to, and it saves
messages into a SQLite database or MCAP file. Replay is done with ros2 bag play, which
republishes the messages on the same topics.
ROS:
  Run:    ros2 launch my_robot.launch.py
  Record: ros2 bag record /camera /imu /cmd_vel       ← separate process
  Replay: ros2 bag play my_bag/                        ← republishes on topics

Copper:
  Run:    cargo run                                     ← logging is automatic
  Read:   cargo run --features logreader --bin my-project-logreader ...
  Replay: feed CopperLists back into the pipeline       ← deterministic
Key differences:
| ROS 2 (rosbag2) | Copper (unified logger) | |
|---|---|---|
| Opt-in vs automatic | You must explicitly record topics | Everything is logged by default |
| Separate process | ros2 bag record runs alongside | Built into the runtime – zero config |
| Format | SQLite / MCAP | Custom binary .copper format |
| Performance impact | Adds subscriber overhead per topic | Near-zero – pre-allocated, memory-mapped |
| Replay mechanism | Republishes on topics | Feed CopperLists directly into tasks |
| Deterministic | Timing depends on DDS, not guaranteed | Timestamps are recorded, replay is deterministic |
| Text logging | Separate (rosout, spdlog) | Unified – text and data in one file |
The biggest philosophical difference: in ROS, recording is something you do. In Copper,
recording is something that happens. You don’t configure it, you don’t start it, you
don’t choose which topics to record. The runtime records everything, always. You only need
to decide what to exclude (via logging: (enabled: false)) if storage is a concern.
This “record everything by default” approach is what makes Copper’s deterministic replay possible. Since every message and every timestamp is captured automatically, you can always go back and reproduce any moment of your robot’s execution.
Keep recordings across restarts and bound disk use
The normal .with_log_path(...) setup creates a fresh recording.
v1.2 Use append when you want another run of the same application in that recording.
v1.3 Use rollover for a robot that must keep recording within a fixed storage budget, retaining recent history as older sections are reclaimed.
This exercise uses the single-crate project from
The Remaining Files and Running. Keep its
src/tasks.rs and task graph, and remove any rate_target_hz setting for the
longer rollover exercise below.
1. Create a short recording
In copperconfig.ron, add or replace the top-level logging section:
logging: (
    slab_size_mib: 4,
    section_size_mib: 1,
    enable_keyframe_logging: false,
),
This exercise uses tasks with no changing internal state and disables keyframe capture to fit the small budget. For a stateful replay application, keep keyframes and budget for their stream as well.
Replace src/main.rs with this complete entry point:
pub mod tasks;

use cu29::prelude::*;
use std::path::Path;
use std::sync::{Arc, Mutex};

#[copper_runtime(config = "copperconfig.ron")]
struct MyProjectApplication {}

fn main() -> Result<(), Box<dyn std::error::Error>> {
    std::fs::create_dir_all("logs")?;
    let logger = UnifiedLoggerBuilder::new()
        .write(true)
        .create(true)
        .file_base_name(Path::new("logs/retained.copper"))
        .preallocated_size(4 * 1024 * 1024)
        .append(false)
        .build()?;
    let UnifiedLogger::Write(logger) = logger else {
        return Err("Expected a write-capable logger".into());
    };
    let app = MyProjectApplication::builder()
        .with_unified_logger(Arc::new(Mutex::new(logger)))
        .build()?;
    let mut running = app.start().expect("start application");
    for _ in 0..10 {
        running.run_one_iteration()?;
    }
    running.stop().expect("stop application");
    Ok(())
}
Run from the project root:
cargo run
It records ten cycles and exits normally. Normal teardown closes the streams
and logger so the next process can append. Keep the entire retained.copper
slab family.
2. Append another run
v1.2
Change .append(false) to .append(true) in that entry point, then run it again:
cargo run
v1.3 Use the logreader’s run-selection commands to inspect the appended recording:
cargo run --features logreader --bin my-project-logreader -- logs/retained.copper list-runs
cargo run --features logreader --bin my-project-logreader -- logs/retained.copper --run 1 extract-copperlists
These commands use the my-project-logreader binary from the book’s first
project; use your generated binary name if you named it differently. The list
now contains two runs. Selecting run 1 exports the second set of ten cycles,
whose CopperList IDs start again for the new construction.
Append requires a cleanly closed log, the same slab allocation size, and matching application metadata and configuration. With self-describing logs it also checks the complete shared catalog. A crash or metadata mismatch rejects append. Use a fresh path when you change the application, mission set, or configuration.
3. Bound the recent history
v1.3
Add .rollover(8 * 1024 * 1024) before .build() on the logger builder and
change the loop to for _ in 0..300_000. Keep .append(true) to continue the
recording already created. Run a release build to avoid printing every debug
line while generating enough cycles to fill the budget:
cargo run --release
cargo run --features logreader --bin my-project-logreader -- logs/retained.copper list-runs
cargo run --features logreader --bin my-project-logreader -- logs/retained.copper fsck
fsck shows a retained CopperList ID range ending at 299999, with the earlier
IDs missing after rollover. Those reported holes are the intentionally reclaimed
history. The start time can also be unknown once its lifecycle event is gone.
The capacity is eight MiB across the logical log; slabs are its backing files. Rollover reclaims the oldest closed data sections as more space is needed. Application metadata and any payload catalog remain available. Those static sections also consume capacity, so leave room for them and the active streams; one MiB sections fit the budget used here.
Run indices follow the first retained section of each run. After rollover,
list runs again before choosing --run: old runs can disappear, and start times
can become unknown when lifecycle events have rotated out. The reader still
knows the mission of each surviving data section. Read order follows the log’s
section links, rather than the numerical order of slab filenames.
Rollover can discard earlier samples and keyframes, so archive a recording you need for full-history analysis or replay before they are reclaimed. If an open section prevents reclamation, the logger returns a space error; it does not silently overwrite a write in progress.
Continue with Self-Describing Logs to share these recordings with readers who do not have your application’s payload types.